
Trading behavior analysis is the systematic examination of how traders execute decisions, using trade timing, position sizing, and discipline data to uncover psychological patterns that erode performance. The formal industry term is behavioral analytics, and it sits at the intersection of trading psychology and quantitative performance review. Most traders focus on strategy. The ones who improve consistently focus on execution. Understanding what is trading behavior analysis, and applying it, separates traders who plateau from those who compound their edge over time.
What is trading behavior analysis and why does it matter?
Trading behavior analysis measures how closely your actual execution matches your trading plan. Strategy drift results from execution noise, not poor strategy design. That distinction matters enormously. You can have a statistically sound system and still lose money because your entries are inconsistent, your stops move, or your position sizes spike after a win.
The analysis covers four core components: entry timing consistency, position sizing discipline, stop placement adherence, and session-level behavioral patterns. Each one leaves a measurable footprint in your trade data. A trader who consistently enters late, for example, shows a timing signature that behavioral analysis can isolate and quantify.

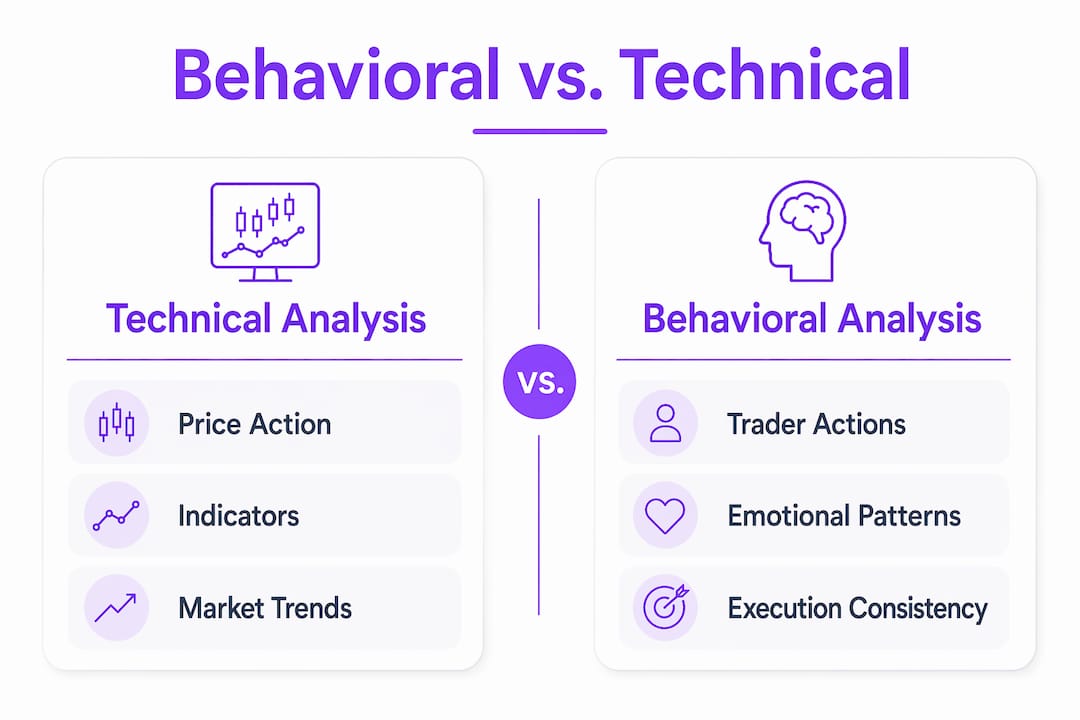
Traditional technical analysis asks, "What is the market doing?" Behavioral analysis asks, "What are you doing in response to the market?" The table below shows how these two approaches differ in focus and outcome.
| Dimension | Technical Analysis | Behavioral Analysis |
|---|---|---|
| Focus | Price action and indicators | Trader execution patterns |
| Data source | Market charts and volume | Trade logs and timestamps |
| Bias detected | None | Loss aversion, FOMO, overconfidence |
| Output | Buy/sell signals | Behavioral pattern corrections |
| Goal | Predict market direction | Improve execution consistency |
Pro Tip: Review your trade log by session time, not just by outcome. Grouping trades by morning, midday, and close reveals timing biases that P&L summaries hide entirely.
The importance of trading analysis at the behavioral level is that it surfaces cognitive biases that technical tools cannot detect. Loss aversion, herding, and overconfidence remain invisible until behavioral data reveals them. That is why behavioral analytics is now considered a separate and necessary layer of performance review for serious traders.
What are the common trading behavior patterns that cause losses?
Five primary emotional patterns account for 80% of behavioral trading losses, each identifiable by specific signatures in trade timing and sizing data. That figure reframes how traders should think about losses. Most losing streaks are not strategy failures. They are behavioral failures with a predictable structure.
"The true trigger of losing streaks lies in pre-streak trades or sessions, not the losses themselves. Behavioral analysis reveals these hidden causes before the damage compounds."
Here are the five patterns, with their triggers, measurable costs, and mechanical fixes:
-
Loss revenge trading. Triggered by a sharp loss or a stopped-out position. The signature is a rapid re-entry within minutes of the loss, often at a larger size. The fix is a mandatory 30-minute cooling rule after any loss exceeding a set threshold.
-
FOMO chasing. Triggered by watching a move develop without you. The signature is a late entry at an extended price, with a stop that is too tight to survive normal retracement. The fix is a pre-session checklist that requires a defined entry zone before any trade is placed.
-
End-of-day urgency. Triggered by a flat or losing session near the close. The signature is a cluster of trades in the final 30 minutes with below-average setups. The fix is a hard stop time rule that prohibits new entries after a set hour.
-
Win overconfidence. Triggered by a strong winning session. The signature is a position size increase on the next trade without a corresponding increase in setup quality. The fix is a fixed sizing rule that does not allow discretionary increases based on recent results.
-
Session fatigue. Triggered by extended screen time. The signature is a gradual decline in entry quality and an increase in impulsive trades after the third or fourth hour. The fix is a maximum daily trade count or a mandatory break after a set number of hours.
Pro Tip: Trying to "feel less emotional" is not a trading strategy. The goal is not to suppress emotions. The goal is to build mechanical rules that make emotional decisions structurally impossible.
Recognizing these trading behavior patterns is the first step. The second step is building rules that interrupt the cycle before it starts, not after the damage is done.
How can behavioral analysis improve emotional control?
Behavioral data functions as an objective digital mirror. It reflects what you actually did, not what you remember doing. Objective behavioral data outperforms self-reported emotional states because memory biases and unawareness during emotional episodes distort recall. Trade timestamps, position sizes, and trade sequences do not lie.
The practical shift this creates is significant. Instead of trying to "stay calm" during a drawdown, you build a rule that automatically reduces your position size by 50% after two consecutive losses. The rule does the work. Your emotional state becomes less relevant.
The table below shows real trade outcome differences before and after applying behavioral analysis fixes.
| Metric | Before Behavioral Fix | After Behavioral Fix |
|---|---|---|
| Average loss size | 1.8R | 1.1R |
| Revenge trade frequency | 3.2 per week | 0.4 per week |
| Win rate on FOMO entries | 31% | N/A (eliminated) |
| End-of-day trade P&L | Negative 68% of sessions | Neutral to positive |
| Max drawdown per session | 4.2% | 1.9% |
Comparing performance during calm versus stressed states reveals a performance gap that motivates traders to change. Quantified disparities provide undeniable evidence of emotional impact. General advice rarely changes behavior. Your own data showing a 40% win rate drop during revenge trading sequences almost always does.
Pro Tip: During high-volatility sessions, reduce your position size before the open, not after your first loss. Pre-session sizing rules are more effective than reactive ones because they remove the decision from an already-stressed state.
Active trading self-analysis means interrogating trade data for patterns rather than passively logging outcomes. The distinction is critical. A journal that records what happened is useful. A system that identifies why it happened and connects it to a behavioral pattern is transformative. Tools like AI feedback systems now automate this interrogation, flagging emotional signatures in real time.
What methods and tools help analyze trading behavior?
The most effective approach to behavioral analysis combines quantitative trade data review with automated pattern detection. Passive journaling, where you write notes after each trade, captures surface-level observations. Active self-analysis goes deeper by measuring entry consistency, sizing variance, hold time distributions, and session-level biases across hundreds of trades.
Key metrics every behavioral analysis system should track:
- Entry timing consistency: How often do you enter within your defined setup window versus chasing?
- Position sizing variance: Does your size increase after wins or losses in ways your plan does not allow?
- Risk per trade adherence: What percentage of trades exceed your maximum risk rule?
- Hold time by outcome: Do you cut winners short and hold losers longer than planned?
- Session bias: Which time blocks produce your worst risk-adjusted results?
Modern AI platforms detect these behavioral signatures automatically, removing the need for manual pattern recognition. The advantage of automation is speed and objectivity. A human reviewing their own trades tends to rationalize. An algorithm flags the pattern without judgment.
Measuring trading indicator performance alongside behavioral metrics gives you a complete picture. You can determine whether a losing period reflects a strategy breakdown or a behavioral breakdown. That distinction changes the fix entirely.
The limitation of self-reporting is real. Most traders cannot accurately recall their emotional state during a trade hours later. Data-driven approaches bypass this problem by reading behavioral intent directly from execution records. Rapid re-entries, size spikes, and late entries all tell a story that self-reporting misses.
How does behavioral analysis fit within trading risk management?
Behavioral analytics is the fourth layer of trading risk management, sitting alongside strategy design, money management, and execution rules. The first three layers are well understood. The fourth is where most retail traders have a blind spot.
Cognitive biases like loss aversion, herding, and overconfidence mask true risk exposure. A trader who believes they are managing 1% risk per trade may actually be running 3% risk on emotional trades because their sizing rule breaks down under stress. Behavioral analysis makes that gap visible.
Domain-dependent contrarian behavior illustrates this well. Retail traders tend to sell winning positions contrarian style while following the trend when holding losses. This asymmetry creates a systematic drag on returns that neither technical analysis nor standard risk management catches.
At the institutional level, behavioral analytics monitors trader states in real time to detect emotional collapse, known as tilt. Erratic sizing and rapid trade sequences trigger alerts that allow risk managers to intervene before a single bad session becomes a catastrophic drawdown. Individual traders can apply the same logic with pre-set rules that automatically reduce exposure when behavioral warning signs appear.
Vanguard's 2026 data reinforces the value of this discipline. Only 14% of retail investors actively traded during geopolitical volatility, with net equity allocation changes averaging less than 4 percentage points. The traders who stayed disciplined avoided the behavioral traps that cost reactive traders significant capital during that period.
Key takeaways
Trading behavior analysis is the most underused performance tool available to retail traders, and the data consistently shows that behavioral failures cause more losses than strategy failures.
| Point | Details |
|---|---|
| Behavioral analysis defined | It measures execution consistency against your trading plan using timing, sizing, and discipline data. |
| Five costly patterns | Loss revenge, FOMO chasing, end-of-day urgency, win overconfidence, and session fatigue cause 80% of behavioral losses. |
| Mechanical fixes beat willpower | Rule-based interventions that interrupt emotional patterns outperform attempts to suppress emotions directly. |
| Data beats self-reporting | Trade timestamps and size records reveal behavioral intent more accurately than post-trade journaling. |
| Fourth risk management layer | Behavioral analytics catches cognitive biases that strategy, money management, and execution rules miss entirely. |
The uncomfortable truth about trading discipline
Most traders I have observed spend years refining their entry signals and almost no time reviewing their execution behavior. The irony is that their signals are usually fine. Their behavior is what is killing them.
The 2026 research on emotional trading patterns confirmed what I have seen repeatedly: the losing trades are not random. They cluster around specific emotional triggers, and those triggers leave fingerprints in the data. Once you see your own revenge trading signature in a chart, you cannot unsee it. That visibility is more motivating than any trading book.
What I find most underappreciated is the role of AI in trading psychology. Technology now makes behavioral pattern detection accessible to individual traders at a level that was previously only available to institutional desks. The barrier is no longer access to tools. The barrier is the willingness to look honestly at your own data.
My strongest recommendation is this: stop trying to trade better by thinking better in the moment. Build the rules before the session starts. Let the structure do the work. Consistent traders are not more emotionally resilient than struggling traders. They have better pre-set constraints that make emotional decisions harder to execute.
— Tony
How Disciplineaiapp turns behavioral data into better trades
Disciplineaiapp is built specifically for traders who already know what they should do and still find themselves breaking their own rules under pressure.
The platform's behavioral analysis features automate the detection of emotional trading signatures, including revenge trading, FOMO entries, and overconfidence sizing spikes, and translate them into specific mechanical rule suggestions. Its automated trade auditing reviews every session and flags deviations from your plan without requiring manual review. The AI learning tools build a personalized behavioral profile over time, so the feedback gets sharper as your data grows. If you are serious about trading discipline best practices, Disciplineaiapp gives you the structure to make them stick.
FAQ
What is trading behavior analysis in simple terms?
Trading behavior analysis is the process of reviewing your trade execution data to identify emotional patterns that cause you to deviate from your plan. It focuses on timing, sizing, and discipline rather than market prediction.
What are the most common trading behavior patterns that cause losses?
The five most costly patterns are loss revenge trading, FOMO chasing, end-of-day urgency, win overconfidence, and session fatigue. Together, these five patterns account for 80% of behavioral trading losses.
How do i analyze my own trading behavior?
Review your trade log by grouping entries by session time, sizing, and outcome sequence. Active self-analysis means looking for patterns across trades rather than evaluating each trade in isolation.
Is behavioral analysis different from trading psychology?
Trading psychology describes the mental and emotional states that affect traders. Behavioral analysis is the quantitative measurement of how those states show up in actual trade execution data. One is descriptive; the other is diagnostic.
Can behavioral analysis replace technical analysis?
No. Behavioral analysis complements technical analysis by adding a layer that identifies trader-driven risks. The two work together: technical analysis informs what to trade, and behavioral analysis improves how consistently you execute the trade.