
Analyzing stock trade performance patterns means uncovering consistent behaviors and outcomes in your trading by combining quantitative data with behavioral insights. Most traders focus on chart setups and miss the deeper signal: their own decision-making errors are the primary drag on returns. The disposition effect causes investors to sell winners too early and hold losers too long, creating a self-reinforcing doom loop that compounds losses over time. Platforms like Disciplineaiapp exist precisely because technical analysis alone cannot fix a behavioral problem. This article gives you a systematic framework for trading pattern evaluation that covers data collection, statistical controls, bias detection, and corrective action.
How to analyze stock trade performance patterns effectively
Effective trade performance analysis, known formally as quantitative trade auditing, starts with the right raw material. You need complete trade history data, not just entry and exit prices. Standardizing trade-level data fields including timestamps, position sizes, entry and exit prices, fees, and leverage is what makes pattern detection mechanical and objective rather than impressionistic.

Without standardization, you are pattern-matching against noise. With it, you can run behavioral classifiers that flag specific error types: revenge trading, FOMO entries, overleverage, and loss averaging down. Each of those labels corresponds to a measurable PnL drag you can quantify in dollar terms.
The core data fields every trader needs to capture are listed below.
- Timestamps (entry and exit, including time of day and session)
- Position size and leverage applied
- Entry and exit prices with slippage noted
- Fees and commissions per trade
- Market context (trend direction, volatility regime at entry)
- Behavioral tag (manual or automated label for the decision type)
Once your data is structured this way, pattern detection shifts from guesswork to analysis. AI-powered tools like Disciplineaiapp's automated trade auditing can ingest this data and return error attribution reports showing which behavioral categories are costing you the most money.
Pro Tip: Export your brokerage data to a CSV and add a single "decision type" column before importing into any analysis tool. Even a rough manual label like "planned," "reactive," or "revenge" gives classifiers a training signal that dramatically improves output accuracy.
What statistical controls reveal about your trading patterns
Raw win rates and average returns tell you very little without context. The most common mistake in stock market pattern recognition is treating a pattern as predictive when it actually reflects the underlying trend regime. A Quanta72 backtest across millions of observations in NYSE stocks found that most candlestick patterns are statistically indistinguishable from matched trend controls. Only the inverted hammer showed a narrow, context-dependent edge. That result should recalibrate how much weight you place on visual chart patterns versus behavioral and structural data.
The correct method is to compare your flagged trades against a matched control sample: trades taken in the same trend regime, same session, and similar volatility conditions. If your FOMO entries underperform your planned entries by 12% on a risk-adjusted basis, that gap is signal. If the gap disappears when you control for session timing, the real variable is when you trade, not how you feel.
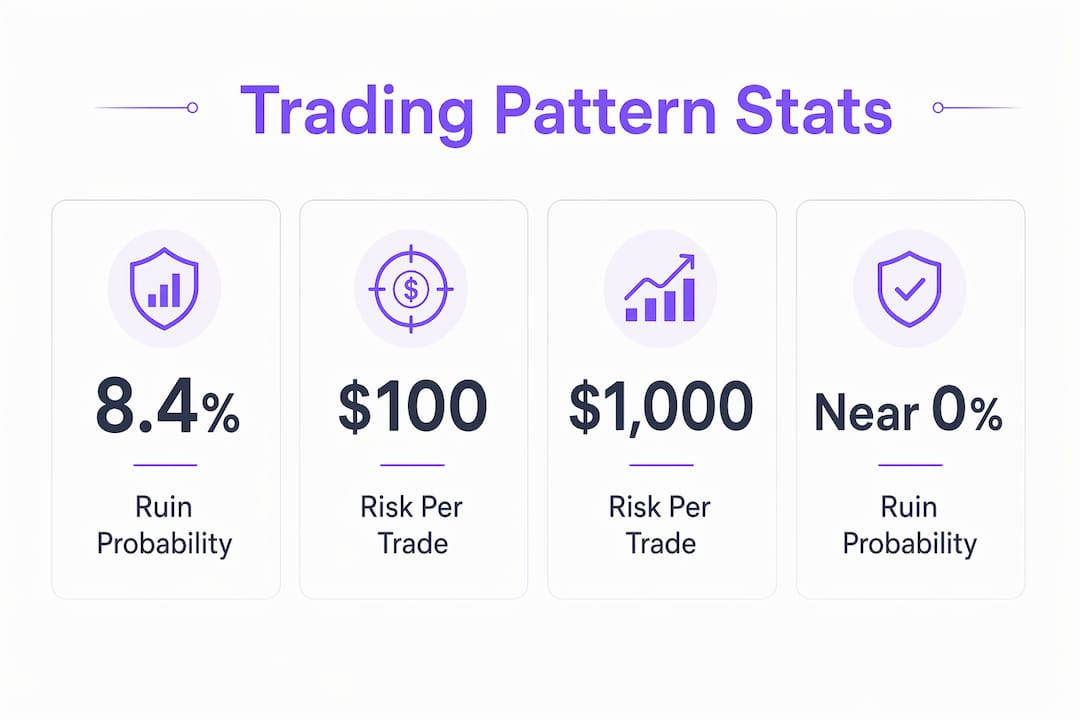
Risk of ruin is the statistical metric most traders ignore until it is too late. The table below shows how dramatically ruin probability changes with position sizing.
| Risk per trade (on $10,000 account) | Ruin probability at 20% drawdown threshold |
|---|---|
| $1,000 (10% per trade) | 8.4% |
| $500 (5% per trade) | ~2.1% |
| $200 (2% per trade) | Near zero |
| $100 (1% per trade) | Effectively zero |
Lowering per-trade risk from $1,000 to $100 on a $10,000 account moves ruin probability from 8.4% to near zero at a 20% drawdown threshold. That is not a marginal improvement. It is the difference between a recoverable losing streak and a blown account.
Pro Tip: Set your position size using the fixed fractional method: risk no more than 1% to 2% of total account equity per trade. At that level, ruin probability stays negligible even across extended losing streaks on a positive-expectancy system.
How behavioral biases distort your performance data
The disposition effect is the single most documented behavioral drag in retail trading. Research tracking 10,000 US brokerage accounts and 190,000 Chinese investors shows that losses increase this bias by 10%. The more you lose, the stronger the urge to hold losers and cut winners. Left unaddressed, this creates a doom loop where each loss deepens the emotional reaction that causes the next loss.
What makes this particularly damaging is that experience does not fix it. Traders with prior losses exhibit stronger disposition effects and repeat costly mistakes, not fewer. The bias is reinforced by emotional memory, not corrected by it. That finding alone justifies building a systematic review process rather than relying on intuition developed through experience.
"The disposition effect is not a beginner's mistake. It is a structural feature of how human memory encodes loss, and it gets worse without deliberate intervention." — Evidence Investor research summary
Beyond the disposition effect, the most common behavioral errors that distort trading pattern evaluation include the following.
- Revenge trading: Entering a trade immediately after a loss to recover, typically with larger size and weaker setup quality
- FOMO entries: Chasing a move after the primary entry point has passed, accepting worse risk-reward ratios
- Overleverage: Sizing positions beyond your risk parameters, usually during high-conviction moments that feel certain
- Loss averaging down: Adding to a losing position without a pre-planned rule, converting a defined loss into an open-ended one
Each of these errors has a distinct signature in your trade data. Revenge trades cluster within minutes of a prior loss. FOMO entries show elevated entry prices relative to the session open. Overleverage appears as position sizes that exceed your stated risk parameters. AI-driven behavioral classifiers can tag all of these automatically, turning qualitative mistakes into quantitative flags.
Pro Tip: Implement a mandatory 90-minute cooldown after two consecutive losses. Behavioral analysis suggests this single rule can eliminate nearly half of the worst flagged trades in a typical audit report.
Step-by-step methods to evaluate trade success systematically
Systematic stock performance analysis follows a repeatable process. The steps below move from raw data to corrective action.
- Assemble and clean your trade dataset. Export complete trade history from your broker. Standardize column names, remove duplicate entries, and fill in missing fields like session time and market regime.
- Label behavioral error types. Manually tag each trade with a decision category or import into a tool like Disciplineaiapp's AI process engine that classifies errors automatically.
- Run matched control comparisons. For each behavioral category, compare performance against trades taken under similar market conditions without the flagged behavior. This isolates the actual cost of each error.
- Calculate error-attributed PnL. Sum the dollar impact of each error type. If revenge trading cost you $4,200 last quarter and FOMO entries cost $1,800, you know exactly where to focus.
- Apply statistical significance tests. A pattern needs enough observations to be reliable. Fewer than 30 instances of a behavior is usually insufficient to draw conclusions. Use a basic chi-square or t-test to confirm the gap is not random.
- Set rule-based responses. For each confirmed error pattern, write a specific rule. "No trades within 90 minutes of a stop-out" is more effective than "trade less emotionally."
- Review and iterate monthly. Re-run the analysis each month to measure whether your rules are reducing the flagged error rate and improving PnL attribution.
The comparison below shows the practical difference between manual journaling and automated analysis.
| Method | Time required | Behavioral detection | PnL attribution | Scalability |
|---|---|---|---|---|
| Manual trading journal | 30-60 min per session | Subjective, inconsistent | Estimated | Low |
| Spreadsheet analysis | 2-4 hours per month | Limited, rule-based | Partial | Medium |
| AI-powered audit tool | Minutes per upload | Automatic, consistent | Exact dollar figures | High |
Manual journals build self-awareness, but they cannot scale to hundreds of trades or catch patterns you are not already looking for. Automated tools like Disciplineaiapp's AI learning features catch patterns you would never notice manually, particularly subtle ones like session-time performance decay or gradual position size creep after winning streaks.
Key takeaways
Analyzing stock trade performance patterns requires combining standardized trade data with behavioral bias detection and statistical controls to identify what is actually costing you money.
| Point | Details |
|---|---|
| Standardize your data first | Consistent timestamps, sizes, and fees make behavioral pattern detection objective and repeatable. |
| Control for trend regime | Most chart patterns lose predictive power once market context is accounted for, per Quanta72 research. |
| Size positions at 1-2% per trade | Fixed fractional sizing keeps ruin probability near zero across realistic losing streaks. |
| Label behavioral errors quantitatively | Tagging revenge trades and FOMO entries in dollar terms shows exactly where to focus improvement. |
| Use a cooldown rule after losses | A 90-minute pause after two consecutive losses can cut the worst flagged trades by nearly half. |
Why most traders analyze patterns wrong
Most traders I have observed spend the majority of their review time on chart patterns and almost none on behavioral data. That is backwards. After years of watching traders work through performance reviews, the clearest predictor of long-term improvement is not whether someone can identify a head-and-shoulders formation. It is whether they can look at their own trade history and say, "I took 14 revenge trades last month, and they cost me $3,100."
Technical patterns are context-dependent to the point of near-uselessness without regime controls, as the Quanta72 research confirms. But behavioral patterns are remarkably stable. The same trader who revenge-traded in February will revenge-trade in September unless something structural changes. That structural change requires data, not willpower.
The traders who improve fastest are the ones who treat their own behavior as a dataset. They do not moralize about bad trades. They count them, cost them, and write rules against them. The risk of ruin framework is similarly underused. Most traders think about drawdowns in percentage terms and never calculate the actual probability of a catastrophic loss given their current position sizing. Running that number once is usually enough to change behavior permanently.
My honest recommendation: run a full behavioral audit on your last 90 days of trading before you change a single entry or exit rule. You will almost certainly find that the problem is not your strategy. It is the 20% of trades where you deviated from it.
— Tony
See your behavioral patterns clearly with Disciplineaiapp
If the framework above describes what you want to do but the manual process feels like too much work, Disciplineaiapp is built for exactly this.
Disciplineaiapp combines AI-powered pattern detection with behavioral error classification to give you the kind of audit that would take hours to do manually. The platform automatically flags revenge trading, overleverage, FOMO entries, and other costly behaviors directly from your trade history. You get dollar-cost attribution by error type, session-based performance breakdowns, and a clear picture of which habits are hurting your returns. Explore the full platform features to see how automated trade auditing translates into measurable performance improvement.
FAQ
What does it mean to analyze stock trade performance patterns?
Analyzing stock trade performance patterns means systematically reviewing your trade history to identify recurring behaviors and outcomes, combining quantitative metrics like PnL attribution with behavioral classifications like revenge trading or FOMO entries.
How do I evaluate trade success beyond win rate?
Win rate alone ignores position sizing and behavioral consistency. Evaluate trade success by comparing risk-adjusted returns across behavioral categories and controlling for market regime to isolate what your decisions actually contributed.
What is the disposition effect and why does it matter?
The disposition effect is the tendency to sell winning trades too early and hold losing trades too long. Research tracking over 190,000 investors shows losses strengthen this bias by 10%, making it a compounding performance drag without deliberate intervention.
How much should I risk per trade to avoid ruin?
Position sizing at 1% to 2% of total account equity per trade keeps ruin probability near zero across realistic losing streaks on a positive-expectancy system, compared to an 8.4% ruin probability at 10% risk per trade.
Can automated tools replace manual trade journaling?
Automated tools like Disciplineaiapp do not replace the self-awareness that manual journaling builds, but they catch behavioral patterns at scale that manual review misses, particularly subtle patterns like session-time decay or gradual size creep after winning streaks.