
Market structure trading is the method of reading price action through the sequence of swing highs and lows to identify trend direction, momentum shifts, and high-probability trade setups. Every chart tells a story through these sequences. Traders who read that story accurately gain a structural edge that lagging indicators simply cannot provide. The three core market states are uptrend, downtrend, and range, each defined by specific swing point patterns. Across forex, crypto, and stock markets, these patterns repeat with remarkable consistency. Disciplineaiapp applies AI-driven analysis to detect these structural shifts in real time, giving traders a data-backed read on market conditions before they commit capital.
What is market structure trading and how does it work?
Market structure trading reads price through the sequence of swing highs and swing lows rather than through any single candle or indicator. Uptrend forms with higher highs and higher lows, downtrend with lower highs and lower lows, and a ranging market with equal highs and equal lows. That three-state framework is the foundation of every structural analysis method used by professional traders.
Two signals define structural events: Break of Structure (BOS) and Change of Character (CHoCH). A BOS occurs when price closes beyond a prior swing high in an uptrend or a prior swing low in a downtrend. It confirms trend continuation. A CHoCH is the first sign that control may be shifting from buyers to sellers, or vice versa. It does not confirm a reversal on its own, but it puts traders on alert.

Single candles hold no structural meaning alone. The sequence of swings is what defines who controls price. A single large bearish candle inside a bullish structure is noise, not a signal. Traders who react to individual candles without reading the broader sequence consistently misread the market.
Candle closes matter more than wicks when confirming structural breaks. A wick that pierces a swing high but closes below it is not a BOS. Only a candle close beyond the level counts as a confirmed structural break. This distinction separates disciplined traders from those who chase false breakouts.
| Pattern | Signal Type | Market Implication |
|---|---|---|
| Higher high + higher low | Uptrend continuation | Buyers in control; look for long setups |
| Lower high + lower low | Downtrend continuation | Sellers in control; look for short setups |
| Equal highs + equal lows | Range or consolidation | No directional bias; stand aside or fade extremes |
| BOS above prior swing high | Trend continuation | Confirms bullish structure; bias remains long |
| CHoCH below prior higher low | Potential reversal | Early warning; wait for confirmation before reversing |
Pro Tip: When a candle closes beyond a structural level on high volume, treat it as a confirmed BOS. When it closes beyond on thin volume, treat it as a candidate for a false break and wait for a retest.
How to use multi-timeframe analysis to read market structure
Multi-timeframe analysis is the practice of reading structure on higher timeframes to set directional bias, then dropping to lower timeframes to time entries. Aligning lower timeframe execution with higher timeframe bias is the "desk principle" used by institutional traders. It reduces noise and increases the probability of any single trade.
The daily and weekly charts set the macro bias. If the daily chart shows a clear sequence of higher highs and higher lows, the structural bias is bullish. Traders who fight that bias on a 15-minute chart are trading against the dominant order flow. Most losing trades come from fighting the higher-timeframe trend on lower-timeframe noise.
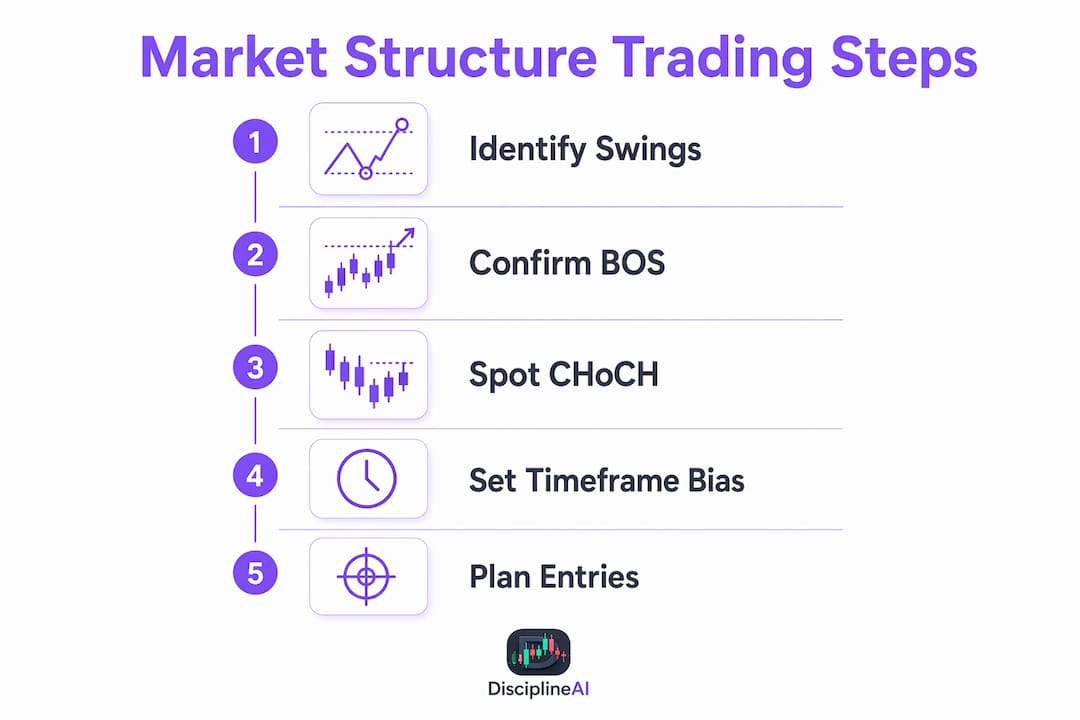
The 4-hour chart serves as the confirmation layer. It shows whether the intermediate structure aligns with the daily bias, and it identifies key swing levels that matter to institutional participants. The 1-hour and 15-minute charts then provide the entry and exit precision.
Here is how each timeframe functions in a structured trading approach:
- Weekly/Daily: Establishes macro trend direction and major swing levels
- 4-hour: Confirms intermediate structure and identifies key support or resistance zones
- 1-hour: Narrows entry windows and confirms CHoCH signals aligned with higher timeframe bias
- 15-minute: Times precise entries and sets stop placement relative to structural lows or highs
Market structure is the only leading indicator that defines the trading environment. Every other tool, from RSI to moving averages, lags price. Structure tells traders when to trade and when to stand aside during choppy consolidations.
Pro Tip: Before placing any trade, write down the daily bias in one sentence. If your trade idea contradicts that sentence, skip it. This single habit eliminates a large share of low-probability setups.
How market structure trading applies to forex, crypto, and stocks
The core swing point logic applies identically across all three markets. Higher highs, higher lows, BOS, and CHoCH work the same way on a Bitcoin chart as they do on EUR/USD or Apple stock. The structural language is universal. What differs is the market mechanics behind the price moves.
The forex market is the world's largest, with daily turnover of $9.6 trillion as of 2026. That scale means institutional players dominate price discovery. Major dealers internalize significant retail order flow, which means visible chart structure can be misleading. A breakout that looks clean on a retail chart may have been engineered to harvest stop-loss clusters sitting just beyond a swing level.
Crypto markets operate 24 hours a day, seven days a week, with no central exchange and thinner liquidity than forex. That combination produces sharper structural breaks and more frequent false breakouts. Swing points on crypto charts tend to be more volatile, so traders typically require a candle close confirmation rather than just a wick beyond a level. Stock markets add the layer of earnings cycles and macroeconomic catalysts, which can override structural bias during high-impact events.
| Feature | Forex | Crypto | Stocks |
|---|---|---|---|
| Daily liquidity | $9.6 trillion | Varies by asset | Varies by exchange |
| Trading hours | 24/5 | 24/7 | Exchange hours |
| Structural reliability | High on major pairs | Moderate, more volatile | High on large caps |
| Institutional influence | Very high | Growing | High |
| False breakout frequency | Moderate | High | Low to moderate |
Institutional desks interpret structure through order flow and liquidity pools, not just visible swing points. They seek stop-loss clusters to facilitate large trades that retail traders never see. Recognizing this dynamic is what separates traders who read structure accurately from those who get caught in institutional traps. Disciplineaiapp analyzes liquidity events and structural shifts across multiple assets and timeframes to flag these setups before they resolve.
What are common mistakes in market structure trading?
The most damaging mistake is fighting the higher-timeframe trend. A trader who sees a bearish CHoCH on the 15-minute chart and shorts into a strong daily uptrend is taking a low-probability bet against dominant order flow. Structure on lower timeframes must align with the higher-timeframe bias before a trade qualifies.
Overreacting to single candles is the second most common error. A large red candle does not break structure. Only a candle close below the most recent higher low breaks bullish structure. Traders who exit or reverse on a single candle miss the actual structural signal and accumulate unnecessary losses from premature decisions.
Entering on a CHoCH without waiting for confirmation is another frequent trap. A CHoCH signals a possible shift, not a confirmed one. The correct response is to watch for a subsequent BOS in the new direction before committing to a reversal trade. Entering on the CHoCH alone produces a high rate of failed trades.
Here are four corrective habits that address the most common structural errors:
- Define the daily bias first. Write it down before analyzing any lower timeframe. Never place a trade that contradicts it.
- Require candle closes for BOS confirmation. Wicks beyond a level do not count. Close beyond the level counts.
- Wait for BOS after CHoCH before reversing. CHoCH is an alert, not a trigger.
- Set invalidation levels before entry. Predefining a trade's invalidation price level allows precise position sizing and removes emotional stop adjustments.
Successful structure trading requires defining invalidation points beforehand, avoiding emotional stops, and calculating position sizes based on clear structural rules. Traders who skip this step consistently over-risk on setups that fail.
Pro Tip: Use your invalidation level as the anchor for position sizing. If the invalidation is 50 pips away and your risk per trade is $200, your position size is fixed. This removes guesswork from every trade.
Key Takeaways
Market structure trading works because it reads the sequence of swing highs and lows, which is the only leading signal that defines trend direction, reversal risk, and when to stand aside.
| Point | Details |
|---|---|
| Three market states | Uptrend, downtrend, and range are defined by higher highs/lows, lower highs/lows, and equal highs/lows. |
| BOS vs. CHoCH | BOS confirms trend continuation; CHoCH is an early warning of a possible reversal, not a confirmed signal. |
| Multi-timeframe alignment | Use daily/weekly for bias, 4-hour for confirmation, and 1-hour or 15-minute for entry timing. |
| Candle close rule | Only a candle close beyond a structural level confirms a break. Wicks do not count. |
| Invalidation levels | Predefine the price that proves your trade wrong before entering, then size your position around that level. |
Why I think most traders learn market structure backward
Most traders I have watched learn market structure by starting on the 5-minute chart and working upward. That is exactly backward. The higher timeframe is the boss. The lower timeframe is just the execution window. When I ignored that hierarchy early in my trading, I took clean-looking setups on the 15-minute chart that were walking straight into daily resistance. The trades looked perfect in isolation. They failed because I had not done the top-down work first.
The second thing I learned the hard way is that liquidity grabs and stop-loss hunting are not rare events. They are a regular part of how institutional players facilitate large orders. Once I started reading structure with that lens, false breakouts stopped surprising me. I began treating them as information rather than failures.
The third insight took the longest to internalize: market structure is not just a technical tool. It is a discipline framework. It tells you when the market is offering a high-probability setup and when it is not. Knowing when to stand aside is just as valuable as knowing when to enter. Disciplineaiapp builds that logic into its stand-aside protection feature, which flags low-probability conditions before traders commit capital.
If you are serious about improving your trading with AI feedback, stop adding indicators and start reading the sequence of swings on the daily chart first. Everything else follows from that.
— Tony
How Disciplineaiapp supports your market structure analysis
Disciplineaiapp is built for traders who want data-driven support across every stage of market structure analysis. The platform reads structural conditions, liquidity events, and trend states across multiple assets and timeframes, then delivers AI-generated trade setups with confidence scores and execution guidance.

Traders who want to deepen their structural knowledge can access the AI Learning Center, where Disciplineaiapp's intelligence engine connects pattern recognition with real market outcomes. The platform also includes trade journaling, behavioral coaching, and AI trade autopsies that show exactly where structural misreads cost you money. Whether you trade forex, crypto, or stocks, Disciplineaiapp's AI pattern detection gives you a structural read that goes beyond what any single indicator can provide.
FAQ
What is market structure trading?
Market structure trading is the practice of reading price action through the sequence of swing highs and lows to identify trend direction, potential reversals, and high-probability trade setups across any market or timeframe.
What is the difference between BOS and CHoCH?
A Break of Structure (BOS) confirms that the current trend is continuing, while a Change of Character (CHoCH) is an early warning that the trend may be reversing. CHoCH requires further confirmation before traders act on it.
How does swing high swing low analysis work?
Swing highs and swing lows are the pivot points that define market structure. A sequence of higher highs and higher lows confirms an uptrend, while lower highs and lower lows confirm a downtrend.
Does market structure trading work in crypto markets?
Market structure principles apply to crypto markets, though crypto's 24/7 trading and thinner liquidity produce more frequent false breakouts. Traders should require candle close confirmation on crypto charts before treating a structural break as valid.
How many timeframes should I use for market structure analysis?
Three timeframes cover most situations: a higher timeframe for bias (daily or weekly), an intermediate timeframe for confirmation (4-hour), and a lower timeframe for entry timing (1-hour or 15-minute). Reading all three in sequence reduces false signals significantly.