
AI-based trading pattern recognition is the process of using computer vision and machine learning to identify geometric chart formations and behavioral trading errors across financial markets. In crypto, forex, and stocks, how AI detects trading patterns comes down to two core engines: convolutional neural networks (CNNs) that read price charts like images, and behavioral classifiers that analyze your trade history for costly habits. Tools built on models like YOLOv8 now achieve 88.5% classification accuracy when fusing visual and numerical data. That number matters because it puts AI-driven detection on par with experienced technical analysts, at a fraction of the time.
How AI detects trading patterns in price charts
AI reads price charts the same way facial recognition software reads a face. It treats the chart as an image, then scans for geometric shapes that correspond to known trading setups.
Cnns: the core visual engine
Convolutional Neural Networks are the standard architecture for this task. A CNN breaks a chart image into small grids and scans each one for visual features: edges, curves, slopes, and intersections. It then assembles those features into higher-level shapes. A rising wedge, a head-and-shoulders formation, or a bull flag each has a distinct geometric signature that a trained CNN learns to recognize.
The key technical advantage is that CNNs provide scale and shift invariance, meaning the same model detects a head-and-shoulders pattern on a $0.003 altcoin and a $400 stock without needing separate calibration. That cross-asset flexibility is something rule-based systems cannot match. Rule-based systems require hand-tuned thresholds for every asset and timeframe. CNNs learn the shape directly from data.
Object detection models like YOLOv8 take this further by locating patterns within a chart in real time, drawing bounding boxes around formations as they develop. This is the same class of model used in self-driving cars to identify pedestrians. Applied to trading, it flags a forming triangle or flag pattern before the breakout occurs.

Here is how the main visual pattern types map to their geometric signatures:
| Pattern | Geometric Signature | AI Detection Method |
|---|---|---|
| Head and Shoulders | Three peaks, center highest | CNN shape classification |
| Ascending Triangle | Flat resistance, rising support | Edge and slope detection |
| Bull Flag | Sharp rally, tight consolidation | YOLOv8 bounding box |
| Double Bottom | Two equal lows, neckline break | Symmetry and inflection detection |
| Wedge | Converging trendlines | Angle and convergence analysis |
- Scale invariance: One model works across crypto, forex, and equities without recalibration.
- Noise tolerance: CNNs filter out minor price fluctuations and focus on dominant shapes.
- Speed: A trained model scans hundreds of charts in seconds, far faster than manual review.
- Learned features: No manual pattern crafting. The model extracts features directly from labeled chart data.
Pro Tip: Run AI chart screening after your manual watchlist scan, not before. Use it to grade the setups you already like, not to generate a list from scratch. This keeps human context in the loop.
How AI analyzes trade history for behavioral patterns
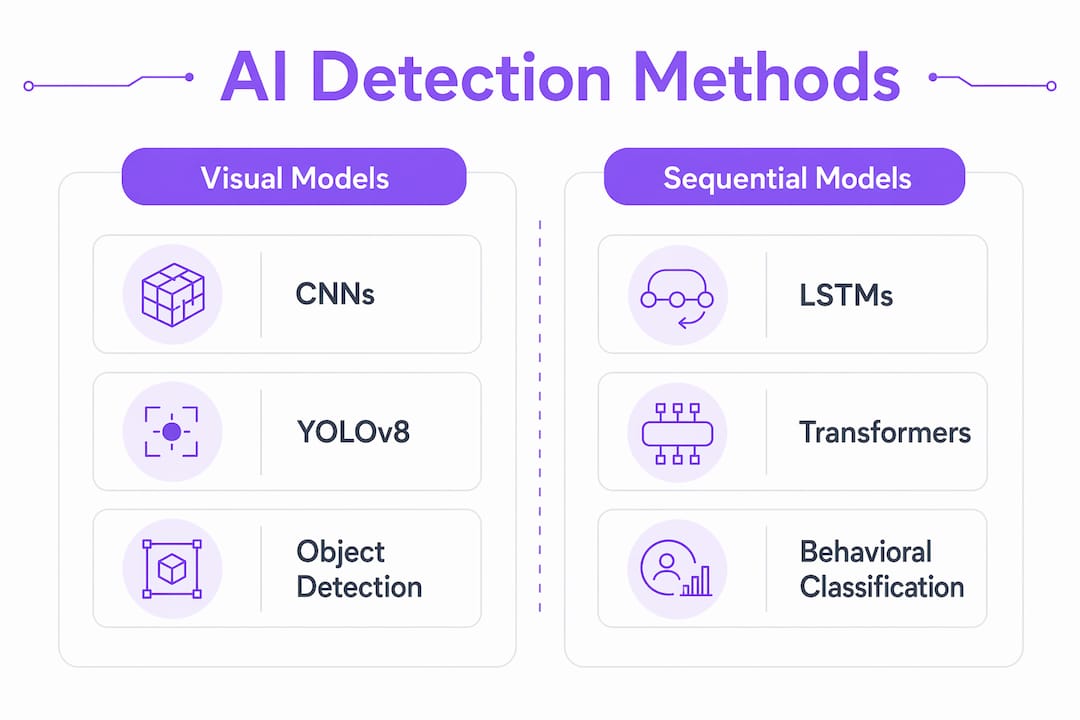
Chart patterns are only half the picture. The other half is you. AI can analyze your personal trade history to detect behavioral errors that repeat across sessions and cost you money.
This is where behavioral pattern detection becomes as valuable as chart analysis. The AI does not just look at what the market did. It looks at what you did, and when, and why the timing suggests an emotional trigger rather than a planned entry.
What behavioral detection actually looks like
Revenge trading has a specific data signature. An AI classifier flags it when a new position opens within 10 minutes of a losing trade and the position size is at least 1.5 times larger than the trader's median size. That is not a judgment call. It is a measurable pattern in the data. Behavioral classifiers identify these errors within minutes of reviewing a trade sequence.
FOMO entries have their own signature: a position opened at a period high, following a candle move of 4% or more, with no pullback. Overleverage is flagged when leverage exceeds twice the trader's personal median. Premature exits are detected when a trade closes before reaching 60% of the original profit target.
- Revenge trading: Entry within 10 minutes of a loss plus outsized position size.
- FOMO entry: Buying at period highs after a large candle with no retracement.
- Overleverage: Position size exceeding 2x the trader's historical median.
- Premature exit: Closing before 60% of the target is reached.
- Overtrading: Abnormal trade frequency within a compressed time window.
These patterns appear across crypto, forex, and stock trading. The asset class changes. The behavioral errors do not. A forex trader revenge trading after a bad London session looks identical in the data to a crypto trader chasing a pump at 2 a.m.
Pro Tip: Export your trade log monthly and run it through a behavioral audit. Patterns that feel random in the moment become obvious when you see them plotted against your loss events.
The role of AI in trading psychology is precisely this: it removes the self-serving bias from your own trade review. You cannot gaslight a classifier.
Cnns vs. lstms vs. transformers: which AI method wins?
No single AI model handles every type of trading pattern well. Modern pattern detection systems use modular architectures that assign different tasks to different model types.
CNNs handle spatial pattern recognition on chart images. Long Short-Term Memory networks (LSTMs) and Transformer models handle sequential data, interpreting how patterns evolve over time and what context surrounds them. Modular AI architectures combine CNNs for spatial detection with LSTMs or Transformers for temporal context, giving a more complete picture than any single model provides.
| Method | Strength | Weakness | Best Use Case |
|---|---|---|---|
| CNN | Geometric shape recognition | Struggles with ambiguous patterns | Chart image classification |
| LSTM | Sequential pattern memory | Slow to train, sensitive to noise | Trend continuation analysis |
| Transformer | Long-range context modeling | Computationally expensive | Multi-timeframe pattern synthesis |
| Classical ML | Fast, interpretable | Requires manual feature engineering | Behavioral error classification |
The risk of relying on a single method is overfitting. A model trained only on bull market data will misclassify patterns in a ranging or bear market. Scale-invariant models normalize price inputs to reduce this risk, but combining multiple model types is the more reliable solution.
Boston University's AI trading lectures recommend that traders build a chest of diverse AI strategies, selecting the best method per market condition rather than defaulting to one approach. That advice applies whether you are building your own system or choosing between commercial tools. A tool that only uses CNNs will miss what a sequence model catches, and vice versa.
Pro Tip: When evaluating any AI trading tool, ask which model types it uses. A tool that only mentions one architecture is likely leaving signal on the table.
How to use AI pattern detection in your trading workflow
AI pattern recognition is most effective as a fast second opinion, not as an autopilot. AI chart analysis reads screenshots and scores patterns, volume, risk-to-reward ratios, and indicator relationships to produce a reasoned trade plan. That output is a starting point for your decision, not the decision itself.
Here is a practical workflow for integrating AI detection into your process:
- Screen manually first. Use your standard technical analysis process to build a watchlist. This keeps your market intuition active and prevents over-reliance on automated outputs.
- Apply AI grading to shortlisted setups. Feed your top candidates into an AI chart analysis tool. Let it score the pattern quality, volume confirmation, and risk-to-reward ratio.
- Check for conflicting signals. A good AI tool flags when a bullish pattern appears alongside a poor risk-to-reward ratio. AI synthesizes conflicting signals so you can decide whether to size up, size down, or skip the trade entirely.
- Run a behavioral audit weekly. Feed your trade log into a behavioral classifier to check for revenge trading, FOMO entries, or overleverage patterns that week.
- Adjust position sizing based on AI confidence scores. High-confidence pattern grades can support larger positions. Low-confidence grades are a signal to reduce size or wait for confirmation.
This workflow applies across crypto, forex, and stocks. The specific patterns differ by market. The decision framework stays the same.
Key takeaways
AI detects trading patterns most accurately when computer vision models and behavioral classifiers work together, covering both chart formations and the trader's own decision history.
| Point | Details |
|---|---|
| CNNs read charts as images | Convolutional networks identify geometric patterns like flags and head-and-shoulders with up to 88.5% accuracy. |
| Behavioral AI audits your habits | Classifiers flag revenge trading, FOMO entries, and overleverage by analyzing your personal trade history data. |
| Modular architectures outperform single models | Combining CNNs, LSTMs, and Transformers covers spatial, sequential, and contextual pattern types more reliably. |
| AI works best as a second opinion | Use AI to grade shortlisted setups after manual screening, not to replace your own market analysis. |
| Diverse strategies reduce overfitting risk | Applying classical ML, deep learning, and generative AI across conditions gives the most consistent detection results. |
Why most traders use AI pattern detection backwards
Most traders I see treat AI pattern recognition as a signal generator. They want it to tell them what to trade. That is the wrong frame, and it is why so many of them end up frustrated when the AI "gets it wrong."
The real value of AI in trading is not prediction. It is synthesis. A CNN can scan 500 charts in the time it takes you to review five. A behavioral classifier can spot that you revenge trade every time you lose more than 2% in a session, a pattern you would never admit to yourself without the data. That is where the edge lives.
The traders I have seen improve most consistently are the ones who use AI to audit themselves, not just the market. They run their trade logs through behavioral detection tools, they grade their own setups against AI scores, and they treat disagreement between their gut and the AI output as a reason to pause, not a reason to override the machine.
The other mistake is expecting one model to do everything. CNNs are excellent at clean geometric patterns. They struggle with ambiguous or transitional formations. Sequence models catch what CNNs miss. Using both is not optional if you want reliable detection across different market conditions in crypto, forex, and stocks.
AI trading pattern recognition in 2026 is mature enough to be genuinely useful. It is not mature enough to replace judgment. Treat it like a very fast, very consistent analyst who never gets tired and never has an ego. Then you are using it correctly.
— Tony
See how Disciplineaiapp detects your trading patterns
Disciplineaiapp is built on exactly this principle: pattern detection should cover both the chart and the trader. The platform's AI-powered trading features include automated trade auditing that flags behavioral errors like revenge trading and FOMO entries in your own history, alongside chart pattern analysis that grades your setups before you enter.
For traders in crypto, forex, and stocks who want to close the gap between knowing what to do and actually doing it, Disciplineaiapp combines the technical and behavioral sides of pattern recognition in one place. Explore the full platform at Disciplineaiapp and see what your trade history has been telling you.
FAQ
What is AI trading pattern recognition?
AI trading pattern recognition is the use of machine learning models, primarily CNNs and behavioral classifiers, to identify geometric chart formations and behavioral trading errors in financial market data. It applies across crypto, forex, and stock markets.
How accurate is AI at detecting chart patterns?
Benchmark tests combining YOLOv8 visual detection with OHLCV data fusion achieved 88.5% overall accuracy in identifying volatility regimes and chart patterns. Accuracy varies by model type and the clarity of the pattern being detected.
Can AI detect behavioral errors in my trading?
Yes. Behavioral classifiers analyze your trade history and flag patterns like revenge trading, FOMO entries, and overleverage using specific data signatures such as entry timing, position size changes, and leverage ratios relative to your personal median.
What is the difference between cnns and lstms in trading?
CNNs identify spatial patterns in chart images, such as triangles and flags. LSTMs analyze sequential data over time, capturing how patterns develop across multiple candles or sessions. Most reliable systems use both together.
Should i replace my analysis with AI pattern detection?
No. AI pattern recognition tools work best as a fast second opinion after your own manual screening, not as a replacement for human judgment and risk management. Use AI to grade and confirm setups, not to generate them from scratch.