
Liquidity void trading is defined as a method of capitalizing on rapid, single-direction price moves that leave behind untraded price ranges the market is mechanically compelled to revisit. These zones, known formally as liquidity voids in market microstructure analysis, appear on charts as large single-candle ranges with almost no wicks and abnormally large bodies. The institutional algorithmic rebalancing that drives price back into these zones creates repeatable, high-probability setups. Traders who understand the mechanics behind void formation gain a structural edge that goes well beyond pattern recognition.
What is liquidity void trading and how does it work?
A liquidity void forms when price moves so fast through a range that no meaningful two-sided trading occurs. The result is a price zone where buyers and sellers never properly interacted. Markets treat these zones as unfinished business. Institutional algorithms are programmed to rebalance price back into them, which is why voids act as magnetic targets on charts.
The key visual signature is a candle with an unusually large body and minimal or zero wicks. That wick absence tells you price moved in one direction without any meaningful rejection or consolidation. A normal candle with long wicks shows two-sided pressure. A void candle shows a one-sided flush with no opposition.

The core trading thesis is straightforward. Price creates a void, moves away, and then retraces back into that zone to restore order book balance. Traders position themselves to catch that retracement. The edge comes from knowing where price is likely to return and at what level to enter with a controlled risk.
How to identify liquidity voids on price charts
Three criteria define a genuine liquidity void: a large candle body, near-zero wicks on both ends, and a volume context that suggests a sudden aggressive move rather than gradual accumulation.
Timeframe selection matters significantly. Voids on 15-minute to 4-hour charts carry institutional weight and fill more consistently than those on sub-15-minute frames. Lower timeframe voids appear frequently but fill less reliably because the market maker infrastructure is thinner. For most traders, the 1-hour and 4-hour charts offer the best signal-to-noise ratio.
Liquidity voids vs. fair value gaps
Traders frequently confuse liquidity voids with fair value gaps (FVGs), which are a related but distinct concept in imbalance trading strategy. The table below shows the key differences:
| Attribute | Liquidity void | Fair value gap |
|---|---|---|
| Formation | Single large candle flush | Three-candle pattern with a gap between candle 1 and candle 3 |
| Size | Typically larger | Smaller, more frequent |
| Wick presence | Near zero | May have partial wicks |
| Fill tendency | Strong magnetic pull | Moderate, context-dependent |
| Institutional weight | High | Moderate to high |
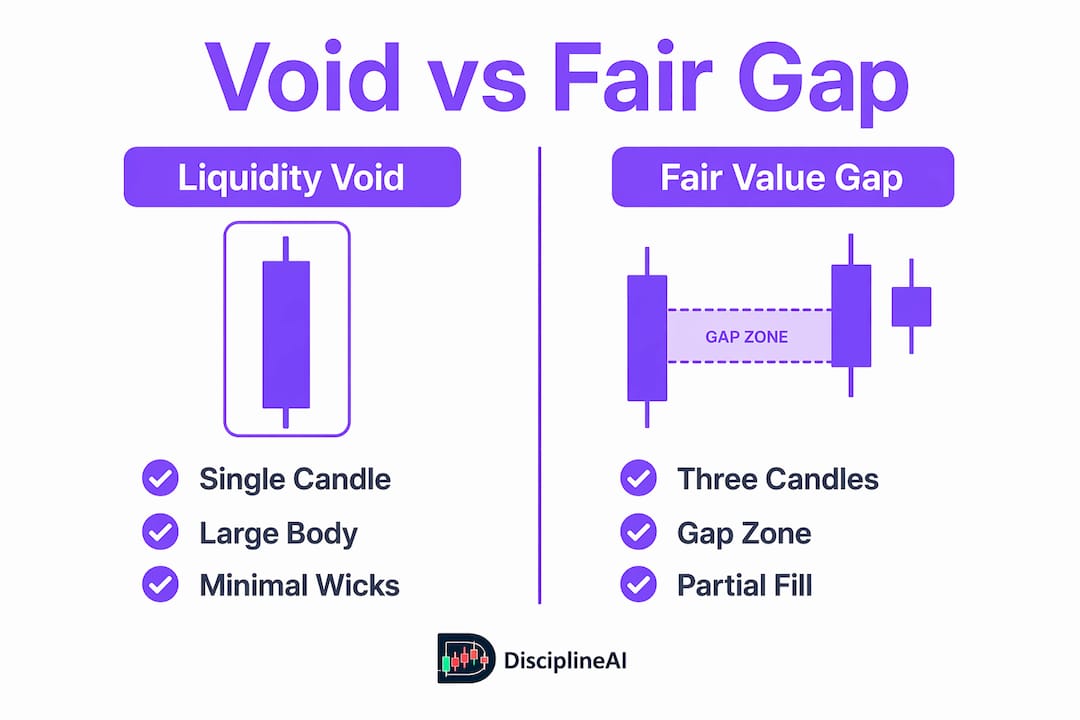
The formation process and scale separate the two concepts. Voids are blunt instruments created by aggressive flushes. FVGs are subtler imbalances created by three-candle sequences. Both matter in market liquidity analysis, but voids carry a stronger rebalancing pull.
Pro Tip: Confirm a void's validity by checking whether the move occurred during a high-activity session. Voids formed during low-volume periods are less reliable because institutional participation is lower.
Why do liquidity voids form?
Liquidity voids arise from order book exhaustion caused by large, aggressive market orders that clear one side of the book rapidly. When a whale-size order or an algorithmic flush hits the market, it consumes all available bids or asks in a price range without allowing any opposing orders to fill. Price traverses that range in milliseconds, leaving it completely untraded.
The institutional logic behind void formation includes several interconnected mechanics:
- Order book clearing: A single large market order wipes out bids or asks across a wide price range, creating a vacuum.
- Algorithmic triggers: Automated systems detect liquidity pools, such as stop clusters above swing highs, and drive price through them to capture that liquidity.
- Liquidation cascades: In cryptocurrency futures markets, forced liquidations from leveraged positions amplify the move, deepening the void.
- Rebalancing requirement: Algorithmic flushes creating voids are designed to trigger liquidity pools but require price to revisit these zones to restore order book balance and proper price discovery.
The rebalancing is not random. It is a mechanical consequence of how modern electronic markets maintain price discovery. When a range has no trade history, the market cannot establish fair value there. Algorithms return to fill that gap because doing so restores the two-sided order flow that markets require to function properly.
Market context shapes how completely a void fills. In a strong trend, price may only partially retrace into the void before continuing in the original direction. In a ranging market, full rebalancing is more common. Understanding trading void dynamics means reading the broader market structure, not just the void itself.
How to trade liquidity voids effectively
Effective void trading comes down to three decisions: where to enter, where to place your stop, and where to take profit. Each decision has a clear framework.
Entry techniques
- Consequent Encroachment (CE) entry: The CE is the 50% midpoint of the void. Institutional algorithms often conclude rebalancing at CE rather than requiring a full 100% fill. Entering at the CE gives you a superior risk-reward ratio because your stop is tighter relative to your target. This is the preferred entry for most void setups.
- Void edge entry: Entering at the near edge of the void, where price first begins to retrace, is more aggressive. It offers a larger potential gain but requires more confidence in the setup because price has not yet confirmed the retracement.
- Lower timeframe confirmation entry: Wait for a lower timeframe market structure shift (LTF MSS) before entering. This means price breaks a prior swing high or low on a lower timeframe, confirming the retracement is underway rather than a continuation of the flush. This entry reduces risk at the cost of a slightly worse fill price.
Stop placement and position sizing
Stop placement is non-negotiable. Stops must be placed beyond the far edge of the void, never inside it. Placing a stop inside the void or at the CE level leads to premature stop-outs before the rebalancing completes. The void itself is the invalidation zone. If price moves through the entire void without reversing, the setup is no longer valid.
Position sizing should reflect the distance from entry to stop. A wider void means a wider stop, which means a smaller position to keep risk constant. Never increase position size to compensate for a wide stop.
Profit targets
Set your first profit target at the CE if you entered at the void edge, or at the full void boundary if you entered at the CE. Take a partial close at the first target, then let the remainder run to the full rebalance level. This approach, closing part of the position at the 50% midpoint and the rest at full fill, captures the most probable outcome while leaving room for the full move.
Pro Tip: In high-volatility environments like cryptocurrency futures, slippage during void retracements can be significant. Use limit orders at your entry level rather than market orders to control your fill price. Pair this with hard stops and defined position sizing as described in crypto risk management best practices.
Common mistakes traders make with liquidity voids
Void trading looks simple on a chart after the fact. Executing it in real time is harder. These are the errors that consistently cost traders money:
- Entering without confirmation: Jumping into a void trade the moment price touches the zone, without waiting for an LTF MSS or any reversal signal, produces a high rate of false entries. Price can continue through a void entirely if the broader trend is strong enough.
- Confusing voids with noise: Not every large candle is a void. A candle with visible wicks, even small ones, suggests some two-sided trading occurred. Applying void logic to these candles produces unreliable setups.
- Ignoring kill zones: Institutional activity peaks during specific session windows, such as the London open and New York open. Voids that form and fill during these kill zones are far more reliable than those in off-hours sessions. Trading voids during low-volume periods invites manipulation and poor fills.
- Placing stops inside the void: Standard practice requires stops beyond the far edge of the void. Stops placed inside the void or at the CE are almost guaranteed to be hit before the rebalancing completes.
- Ignoring risk-reward balance: A void setup with a 1:1 risk-reward ratio is not worth taking. The edge in void trading comes from asymmetric setups where the potential gain is at least twice the risk. If the math does not work, skip the trade.
Traders who focus on partial void fills at the 50% midpoint, rather than waiting for a full 100% rebalance, consistently improve their risk-reward ratios. Full fills happen, but they are not the most probable outcome in every market condition.
Key Takeaways
Liquidity void trading works because institutional algorithms are mechanically required to rebalance price into untraded zones, creating repeatable, high-probability retracement setups for disciplined traders.
| Point | Details |
|---|---|
| Void identification | Look for large single-candle bodies with near-zero wicks on 15-minute to 4-hour charts. |
| CE entry advantage | The 50% midpoint of the void is the primary institutional rebalancing target and offers the best risk-reward entry. |
| Stop placement rule | Always place stops beyond the far edge of the void, never inside it. |
| Confirmation matters | Wait for a lower timeframe market structure shift before entering to reduce false signal risk. |
| Kill zone timing | Voids formed during London and New York session opens fill more reliably than off-hours voids. |
What I've learned trading voids in volatile markets
Liquidity void trading clicked for me when I stopped treating voids as simple "fill the gap" setups and started reading them as evidence of institutional intent. Every void tells a story about who moved price, why they moved it, and where they are likely to return. That reframe changed how I approached entries entirely.
The algorithmic influence in modern crypto markets makes voids more common and more pronounced than in traditional equity markets. Liquidation cascades on leveraged positions create some of the cleanest voids I have ever seen on a chart. The flip side is that volatility during the retracement can be brutal if your stop is misplaced. I learned that lesson the hard way more than once.
The traders I have seen succeed with this framework consistently do two things. They combine void analysis with broader market structure analysis to confirm the directional bias, and they use automation to flag void formations in real time rather than hunting for them manually. Manual scanning across multiple timeframes and assets is where discipline breaks down. You miss setups, or worse, you force setups that are not there.
Disciplineaiapp has changed how I think about this problem. Having an AI layer that continuously monitors market structure and flags liquidity events removes the cognitive load of constant chart watching. The behavioral coaching component is equally underrated. Void trading requires patience. The setup has to come to you. Any tool that reinforces that discipline is worth using.
— Tony
How Disciplineaiapp supports your void trading strategy
Identifying liquidity voids manually across multiple assets and timeframes is time-consuming and error-prone. Disciplineaiapp's AI pattern recognition engine monitors market structure, liquidity events, and price imbalances continuously, flagging potential void setups with confidence scores so you can focus on execution rather than scanning.

The platform's AI-powered trading tools include trade journaling, market replay, and AI trade autopsies that let you review how your void trades performed and where your execution broke down. The stand-aside protection feature helps you avoid low-probability setups during unfavorable conditions. For traders serious about applying void and fair value gap strategies with consistency, Disciplineaiapp provides the structure and feedback loop that manual trading cannot replicate.
FAQ
What is a liquidity void in trading?
A liquidity void is a price zone created by a rapid, single-direction move where no meaningful two-sided trading occurred. It appears on charts as a large candle body with near-zero wicks, and markets tend to retrace into these zones to restore order book balance.
How is a liquidity void different from a fair value gap?
A liquidity void forms from a single large candle flush, while a fair value gap forms from a three-candle pattern. Voids are typically larger and carry a stronger rebalancing pull than fair value gaps.
What timeframes work best for liquidity void trading?
The 15-minute to 4-hour timeframes produce the most reliable voids with institutional weight. Sub-15-minute voids appear more frequently but fill less consistently due to thinner market maker participation.
Where should I place my stop loss in a void trade?
Place your stop beyond the far edge of the void, never inside it. Stops placed within the void range are routinely hit before the rebalancing move completes, resulting in premature exits.
What is Consequent Encroachment in void trading?
Consequent Encroachment (CE) is the 50% midpoint of a liquidity void. Institutional algorithms frequently conclude rebalancing at the CE rather than filling the entire void, making it the primary profit target and preferred entry level for traders using this framework.