
What is walk forward analysis and why does it matter?
Walk forward analysis is the gold standard for validating trading strategies, and if you're still relying on a single static backtest, you're probably fooling yourself. First formalized by Robert E. Pardo in his 1992 book Design, Testing and Optimization of Trading Systems, the method works by repeatedly optimizing strategy parameters on a rolling window of historical data, then immediately testing those parameters on the next unseen segment. You get multiple out-of-sample results, not one. That distinction changes everything about how you interpret a strategy's real potential.
Traditional backtesting gives you one answer from one fixed data split. Walk forward analysis gives you a distribution of answers across many sequential periods, each one genuinely unseen at the time of optimization. The method eliminates look-ahead bias by strictly respecting causal time order: training always precedes testing, with no data from the future leaking backward. The result is a validation process that closely mirrors how a trader actually operates, making decisions sequentially without knowing what comes next.
Why does this matter in practice? Because a strategy that looks brilliant on a single backtest may simply be overfit to one market regime. Walk forward analysis forces evaluation across multiple regimes, including bull markets, bear markets, and choppy transition phases, exposing fragile strategies that a single backtest run would hide entirely.
Key properties of walk forward analysis at a glance:
- Iterative rolling window optimization on in-sample data
- Immediate out-of-sample testing on the period that follows each training window
- Multiple test cycles aggregated into a single performance summary
- No look-ahead bias due to strict temporal ordering
- Exposure to diverse market regimes rather than a single historical snapshot
- Simulation of real sequential decision-making under live conditions
How does walk forward analysis differ from traditional backtesting?
The core difference is how each method handles data. Traditional backtesting uses one fixed historical dataset, split once into an in-sample training period and an out-of-sample test period. You optimize on the first chunk, test on the second, and call it done. Walk forward analysis, by contrast, uses multiple training and testing cycles, rolling the window forward after each cycle so that every out-of-sample segment is genuinely new.

That structural difference has real consequences. A single backtest split can accidentally align with a favorable market regime, producing results that look strong but won't hold up. Rolling cycles spread the validation across many different conditions, so a strategy has to perform consistently rather than just once.
| Attribute | Traditional backtesting | Walk forward analysis |
|---|---|---|
| Data split | One fixed in-sample / out-of-sample split | Multiple rolling in-sample and out-of-sample cycles |
| Overfitting risk | High; parameters tuned to one period | Lower; parameters re-optimized across many periods |
| Market regime coverage | Limited to one historical stretch | Spans bull, bear, and transitional phases |
| Look-ahead bias | Possible if split is chosen post-hoc | Eliminated by strict temporal ordering |
| Result output | Single performance estimate | Distribution of out-of-sample results |
| Data efficiency | Low; test set used only once | High; rolling windows reuse data across cycles |
| Complexity | Low | Moderate to high |
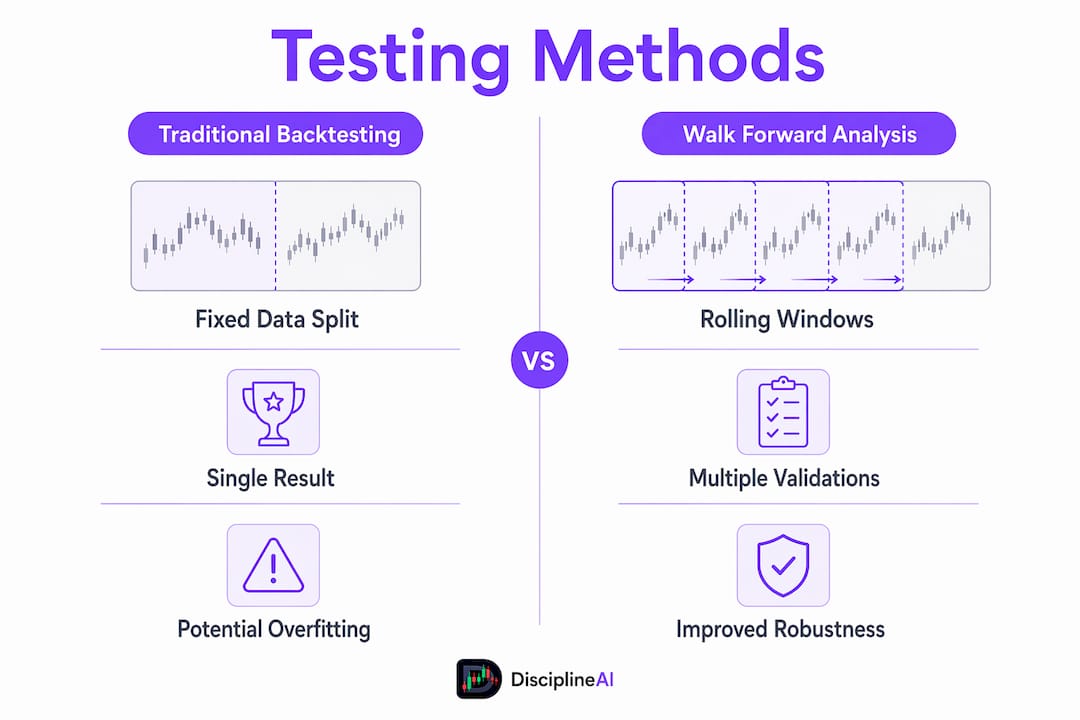
The practical takeaway: backtesting tells you whether a strategy could have worked. Walk forward validation tells you whether it tends to work across changing conditions.
Where traditional backtesting still has a role:
- Early-stage strategy screening before committing to full walk forward cycles
- Rapid feasibility checks on new parameter ideas
- Situations where historical data is too limited for multiple rolling windows
- Educational purposes when introducing a strategy concept for the first time
How the rolling window process actually works
Walk forward analysis runs as a sequence of optimization-and-test cycles, each one moving forward in time. Here is the exact logic behind each cycle.
- Divide your historical data into sequential segments. Set a fixed training window length (say, 12 months) and a testing window length (say, 3 months). The first training window covers months 1–12; the first test window covers months 13–15.
- Optimize parameters on the training window. Run your chosen optimization method, such as a grid search or an evolutionary algorithm, across the training period. Record the parameter set that produces the best in-sample result.
- Apply those parameters to the test window. Run the strategy on months 13–15 using only the parameters found in step 2. Record the out-of-sample performance. Do not touch these parameters again during this cycle.
- Roll the window forward. Shift both windows ahead by the length of the test period. The new training window covers months 4–15; the new test window covers months 16–18. Repeat steps 2 and 3.
- Continue until you reach the end of your data. Each cycle adds one more out-of-sample result to your collection.
- Aggregate all out-of-sample results. Combine the results from every test window into a single performance summary. This aggregate, not any individual cycle, is your strategy's true validation output.
Two window variants exist. A rolling window keeps the training length fixed as it moves forward, which keeps the model focused on recent data. An expanding window grows the training set with each cycle by adding new data without dropping old data, which can improve stability but risks including outdated market conditions in the optimization.
Pro Tip: The rolling window approach generally works better for strategies sensitive to regime changes, since it prevents older, irrelevant market behavior from dominating the optimization.

Why walk forward validation outperforms other methods
The advantages here are not theoretical. They show up directly in whether a strategy survives contact with live markets.
- Realistic simulation of live trading. Each test window is genuinely unseen at the time of optimization, which mirrors the conditions a trader faces in real time. No other common validation method replicates this as closely.
- Reduced overfitting. Because parameters are re-optimized on each rolling window rather than tuned once to a full dataset, the method naturally limits the degree to which a strategy can be curve-fitted to noise.
- Regime coverage. Multiple cycles span different market environments. A strategy that only works in trending markets will show that weakness clearly when a sideways or volatile cycle appears in the test windows.
- Better data efficiency. Rolling windows reuse historical data across many cycles, extracting more information from a fixed dataset than a single split ever could.
- Performance consistency as a signal. Rather than a single pass/fail result, you get a distribution of outcomes. Consistent positive results across cycles are a much stronger signal of genuine edge than one good backtest number.
- Identification of vulnerabilities. Cycles where the strategy underperforms reveal which market conditions it struggles with, giving you specific information to act on rather than a vague "the backtest looked good."
How to implement walk forward analysis step by step
A clean implementation follows a clear sequence. Cutting corners at any stage undermines the validity of the entire process.
- Prepare and clean your historical data. Remove gaps, adjust for splits and dividends, and verify that timestamps are accurate. Errors in raw data propagate through every cycle and corrupt results silently.
- Define your window parameters. Choose a training window length, a testing window length, and a step size. The step size determines how far the window advances after each cycle. A common starting ratio is 4:1 or 5:1 for training to testing length.
- Select your optimization method. Grid search works for small parameter spaces. Evolutionary algorithms or Bayesian optimization handle larger spaces more efficiently. The method should be consistent across all cycles.
- Run the first optimization cycle. Apply your chosen method to the first training window. Record the best parameter set according to your chosen objective function, such as Sharpe ratio or profit factor.
- Test on the out-of-sample window. Apply the recorded parameters to the immediately following test period. Log every performance metric you care about: returns, drawdown, win rate, and Sharpe ratio.
- Roll forward and repeat. Advance the window by the step size and run the next cycle. Continue until the full dataset is covered.
- Aggregate and analyze results. Combine all out-of-sample windows into a single performance summary. Look at the distribution of results across cycles, not just the average.
A practical implementation always includes preparing clean historical data, setting rolling in-sample windows for optimization, testing on out-of-sample forward periods, and aggregating results before drawing any conclusions.
Pro Tip: Never go back and re-test the same out-of-sample data after reviewing results. Each test window gets exactly one evaluation. Re-testing the same data is the fastest way to introduce subtle data snooping bias and produce results that look validated but aren't.
Data quality, segmentation, and optimization considerations
The validity of walk forward results depends entirely on the quality of the inputs and the care taken in segmentation. A technically correct process applied to bad data still produces garbage.
- Data quality is non-negotiable. Survivorship bias, missing bars, and incorrect price adjustments all distort results. Use adjusted price series for equities and verify data against a secondary source before running any cycles.
- Window sizing requires deliberate judgment. Too short a training window produces unstable parameters because there isn't enough data to identify a genuine signal. Too long a window includes market conditions so old they're irrelevant to current behavior. A practical starting point is a training window that covers at least two full market cycles.
- Respect market cycle boundaries when possible. Segmenting windows so they align with identifiable regime shifts, such as pre- and post-major policy changes, gives each cycle more interpretive clarity.
- Use embargo periods between training and testing windows. When a strategy's prediction horizon overlaps with the start of the test window, data from the future can leak backward into the training set. An embargo gap equal to the maximum forecast horizon length prevents this leakage.
- Match your optimization method to your parameter space. Grid search is exhaustive but slow for large spaces. Evolutionary algorithms like genetic algorithms handle dozens of parameters efficiently. Machine learning-based methods can find non-linear parameter relationships that grid search misses entirely.
- Avoid over-parameterization. Every additional parameter you optimize is another opportunity to overfit. Strategies with fewer, more meaningful parameters tend to generalize better across walk forward cycles.
Key performance metrics for evaluating results
Interpreting walk forward outcomes requires looking at a set of metrics together, not any single number in isolation. The goal is to understand both the return profile and the risk profile across all test cycles.
- Cumulative return across all out-of-sample windows: the total profit or loss generated by the strategy during all test periods combined
- Maximum drawdown: the largest peak-to-trough decline observed across the aggregated out-of-sample equity curve
- Sharpe ratio: risk-adjusted return calculated as the ratio of average excess return to standard deviation of returns
- Win rate: the percentage of trades that closed profitably across all test windows
- Profit factor: gross profit divided by gross loss; values above 1.5 generally indicate a viable edge
- Consistency across cycles: how many individual test windows produced positive results versus negative ones
- Distribution of cycle-level Sharpe ratios: a strategy with a high average Sharpe but wide variance across cycles is less reliable than one with a moderate but consistent Sharpe
Common performance metrics include profitability, maximum drawdown, Sharpe ratio, win rate, and consistency across testing windows. The table below maps each metric to its primary purpose in evaluation.
| Metric | Definition | What it tells you |
|---|---|---|
| Cumulative return | Total out-of-sample profit or loss | Whether the strategy generated positive value overall |
| Maximum drawdown | Largest peak-to-trough equity decline | Worst-case capital risk during the test period |
| Sharpe ratio | Average excess return divided by return standard deviation | Return per unit of risk; higher is better |
| Win rate | Percentage of profitable trades | Frequency of correct directional calls |
| Profit factor | Gross profit divided by gross loss | Efficiency of the strategy's edge |
| Cycle consistency | Fraction of test windows with positive returns | Stability of performance across different market conditions |
A strategy passes walk forward validation not by maximizing any single metric but by showing consistent, positive performance across the majority of test cycles. One exceptional cycle surrounded by losses is a red flag, not a green light.
Software and tools that support walk forward testing
Several platforms and programming environments support walk forward testing natively or through libraries, each suited to different levels of technical depth.
- Python with libraries such as scikit-learn, Backtrader, and Zipline: Python gives you full control over window logic, optimization methods, and result aggregation. Scikit-learn's
TimeSeriesSplitclass implements rolling cross-validation directly applicable to walk forward setups. Backtrader and Zipline handle strategy execution and data management. - R with the quantstrat and PerformanceAnalytics packages: R's quantstrat package supports strategy definition and parameter optimization, while PerformanceAnalytics provides the metrics needed to evaluate each cycle's output.
- Dedicated trading platform environments: Several professional trading platforms include built-in walk forward optimization modules that automate the rolling window process and generate performance reports without requiring custom code. These platforms vary in their flexibility for custom objective functions.
- Computational planning matters. Walk forward analysis is computationally intensive, requiring multiple full optimization cycles across the entire dataset. High-frequency strategies or large parameter spaces can require significant processing time. Cloud computing resources or parallel processing frameworks help manage this at scale.
- Disciplineaiapp's analytics and learning resources: Disciplineaiapp provides performance analytics and trade journaling tools that complement walk forward workflows, helping traders track out-of-sample results, identify behavioral patterns, and interpret strategy performance across changing market conditions. The platform's AI-generated trade setups and confidence scoring also reflect the kind of ongoing parameter reassessment that walk forward analysis formalizes. Traders looking to deepen their understanding of validation techniques can explore the AI learning center for structured educational content on strategy development.
Best practices to avoid the most common walk forward pitfalls
Even a correctly structured walk forward process can produce misleading results if certain discipline failures creep in. These are the ones that trip up experienced practitioners, not just beginners.
Pro Tip: Set your embargo gap before running any cycles and treat it as fixed. Adjusting the embargo after seeing results is a form of data snooping, even if it feels like a methodological refinement.
- Apply the "one bite of the apple" principle strictly. Repeated testing on identical out-of-sample data should be avoided to prevent over-optimization and the illusion of robustness. Once a test window has been evaluated, its results are final. Going back to adjust parameters and re-test that same window invalidates the entire validation.
- Watch for window position bias. If your test windows consistently land during favorable market periods, the aggregate result will look better than it deserves. Check whether your results hold across windows that include drawdown-heavy periods.
- Reassess model performance as regimes shift. Walk forward analysis is not a one-time exercise. A strategy validated on data through 2023 may need re-validation after a major structural shift in volatility or correlation regimes. Continuous re-optimization reflects how traders actually behave in live markets.
- Keep parameter counts low. Each additional free parameter multiplies the risk of overfitting within each training window. If a strategy requires ten or more parameters to show positive results, the walk forward process is fighting an uphill battle against curve-fitting.
- Plan for computational demands upfront. Complex strategies tested across long histories with many parameter combinations can take hours or days to run. Underestimating this leads to shortcuts, such as reducing the number of cycles or narrowing the parameter search, that compromise the validity of results.
- Separate final validation from exploratory testing. Use walk forward cycles for exploration and refinement, but reserve one final out-of-sample period that you have never touched for the definitive validation. That final test is the only one that truly counts as an unbiased estimate of live performance.
Key Takeaways
Walk forward analysis produces reliable strategy validation by testing optimized parameters on multiple genuinely unseen data segments, making it far more predictive of live performance than any single static backtest.
| Point | Details |
|---|---|
| Rolling window structure | Parameters are re-optimized on each training window and tested on the immediately following unseen period. |
| Regime coverage | Multiple cycles span bull, bear, and transitional markets, exposing fragile strategies a single backtest hides. |
| Embargo periods | A gap equal to the maximum forecast horizon between training and testing windows prevents look-ahead leakage. |
| One-bite principle | Each out-of-sample window is evaluated exactly once; re-testing the same data introduces snooping bias. |
| Metrics distribution | Evaluate consistency across all test cycles, not just the aggregate average, to identify genuine edge. |