
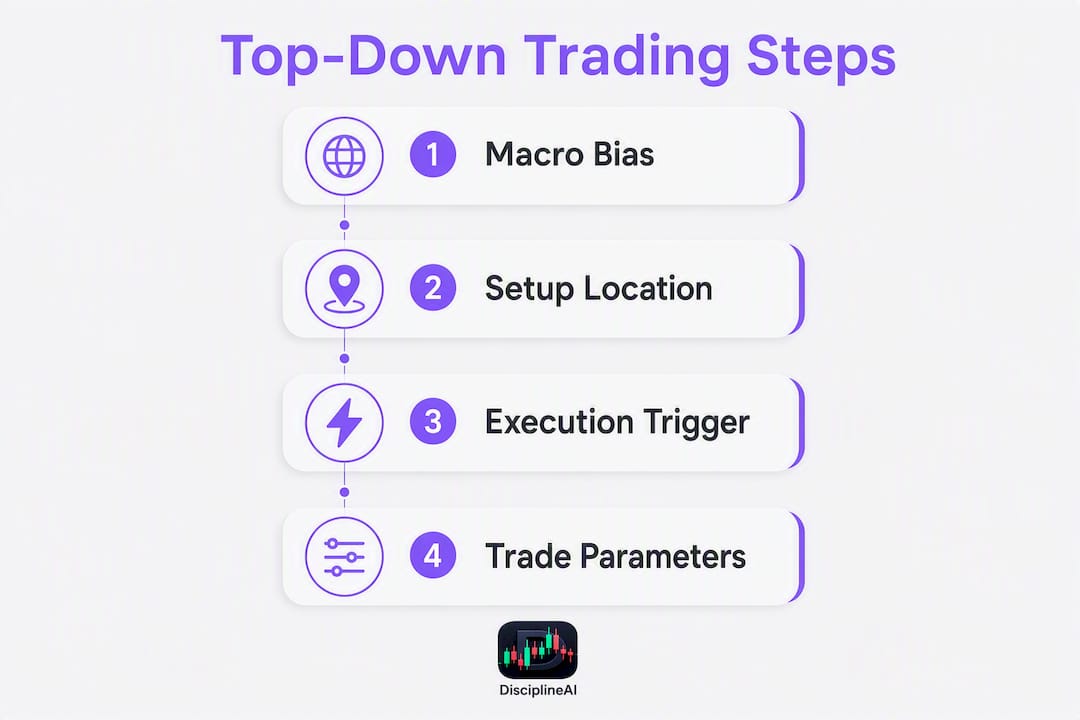
Top-down analysis trading means reading price from the highest relevant timeframe down to your execution timeframe, so every entry aligns with the macro structure rather than fighting it. The one-line workflow: Macro timeframe → Setup timeframe → Execution timeframe. That's the pyramid, and everything else in this guide is built around it.
For forex and futures traders specifically, this matters more than it does for equity investors. You're operating with leverage, session-driven liquidity, and correlated instruments that can move together without warning. A clean signal on a 5-minute chart means almost nothing if the daily chart is sitting at a major resistance level with bearish structure. Higher timeframes carry the narrative; lower timeframes carry the timing.
Pre-trade checklist (run this before every entry):
- Higher-timeframe bias confirmed (bullish or bearish structure)
- Setup timeframe shows price at a valid zone (support, demand, order block)
- Execution timeframe has produced a trigger (break of structure, rejection wick, engulfing candle)
Pro Tip: Assign each timeframe exactly one job: bias, location, or confirmation. The moment you let your 5-minute chart set your directional bias, you've broken the system.
Table of Contents
- What is top-down analysis and why do forex and futures traders rely on it?
- How does the three-timeframe framework actually work?
- How do you read trend, support, and resistance on higher timeframes?
- Which indicators confirm top-down alignment without adding noise?
- What is the exact pre-trade workflow you should run every time?
- A worked example: applying the workflow to EUR/USD
- What mistakes do traders make, and how do you fix them with journaling?
- How do you set up a multi-timeframe workspace that saves time?
- How do volume profile and order flow fit into multi-timeframe analysis?
- How do you integrate news events and the economic calendar into the top-down process?
- Key Takeaways
- Why most traders get top-down analysis wrong
- Disciplineaiapp puts the top-down checklist on autopilot
- Further reading and useful sources
What is top-down analysis and why do forex and futures traders rely on it?
Top-down analysis starts with the broadest context and narrows to the specific. In trading, that means reading macro structure on the weekly or daily chart before you ever look at a 15-minute setup. The method borrows directly from top-down investing, where analysts start with macroeconomic factors like GDP growth and interest rates before selecting sectors and individual securities. Applied to charts, the same logic holds: context first, entry second.
The contrast with bottom-up analysis is worth spelling out. Bottom-up traders start with a specific instrument or pattern and work outward. That approach has its place in equity research, where a single company's fundamentals can override sector trends. In forex and futures, it's a liability.
| Dimension | Top-down | Bottom-up |
|---|---|---|
| Starting point | Macro structure / higher timeframe | Entry signal / lower timeframe |
| Primary strength | Directional alignment, fewer false breakouts | Speed, pattern recognition |
| Common blind spot | Can miss fast-moving setups | Ignores higher-timeframe context |
| Best fit | Forex, futures, leveraged instruments | Equity stock selection |
Why does the top-down approach trading method hold up so well in forex and futures specifically?
- Leverage amplifies context errors. A wrong-direction entry on a 10:1 leveraged futures position hurts far more than the same mistake in an unleveraged stock portfolio.
- Session structure creates predictable liquidity. The London open, New York open, and their overlap produce repeatable volatility windows that only make sense when you understand where price is relative to higher-timeframe levels.
- Central bank policy shapes multi-week bias. A Federal Reserve rate decision doesn't just move price on the day of the announcement; it shifts the macro bias that your daily chart reflects for weeks afterward.
- ATR (Average True Range) on the higher timeframe gives you a realistic volatility baseline before you size any position.
How does the three-timeframe framework actually work?
The pyramid has three levels, and each one has a single job. Blur those jobs and the whole system breaks down.
Level 1 — Macro/Bias timeframe: Identifies the dominant trend direction and major structural levels. You're not looking for entries here. You're asking: is price in a bullish or bearish phase, and where are the major zones it's likely to react to?

Level 2 — Setup/Location timeframe: Narrows the trade idea to a specific zone. Price has pulled back to a higher-timeframe demand area, or it's consolidating below a resistance level. This is where you decide whether the trade is worth watching.
Level 3 — Execution/Trigger timeframe: Provides the actual entry signal. A break of structure, a rejection wick, or an engulfing candle that confirms price is reacting at the zone you identified on Level 2.
Recommended timeframe pairs by trading style
| Trading style | Macro timeframe | Setup timeframe | Execution timeframe |
|---|---|---|---|
| Swing (forex) | Weekly / Daily | 4H | 1H |
| Intraday (forex) | Daily | 4H | 15M |
| Intraday (futures, e.g., ES) | Daily | 1H | 5M |
| Scalping (futures) | 1H | 15M | 1M–3M |
What to mark on each timeframe:
- Macro: Major swing highs/lows, weekly/daily support and resistance, 50/200 moving average slope, overall market structure (uptrend, downtrend, range)
- Setup: Order blocks, supply/demand zones, fair value gaps (FVGs), session highs/lows, 4H structure
- Execution: Break of structure (BOS), change of character (CHOCH), rejection wicks, volume spikes at key levels
Pro Tip: Keep the pyramid to three levels. Four or five timeframes sounds thorough; in practice it produces analysis paralysis. Three levels, one job each.
How do you read trend, support, and resistance on higher timeframes?
The higher timeframe is where your trade either has a foundation or it doesn't. Getting this step right is the difference between trading with the market and trading against it.
Reading trend direction:
- Higher highs and higher lows confirm a bullish structure. Lower highs and lower lows confirm bearish. Simple, but most traders skip this check when a lower-timeframe setup looks attractive.
- Moving average slope: A 50-period MA sloping upward on the daily chart is a fast, visual confirmation of trend. The 200-period MA tells you the longer-term regime. When price is above both and both are sloping up, the bias is unambiguously bullish.
- Market structure shifts (MSS/BOS/CHOCH): A Break of Structure (BOS) in the direction of the trend confirms continuation. A Change of Character (CHOCH) signals a potential reversal and should put you on alert to reassess bias.
Applying multi-timeframe confluence means identifying where levels from two or more timeframes overlap. A daily support level that also sits at a weekly demand zone is a far stronger location than either level alone.
Prioritizing support and resistance levels:
- Prior swing highs and lows that produced significant reactions
- Liquidity nodes where price consolidated before a strong move (these tend to act as magnets)
- Round-number levels (1.1000 in EUR/USD, 4500 in ES futures) because large institutional orders cluster there
- Session highs and lows from the prior London or New York session
When two levels sit within a few ticks of each other, treat them as a single zone rather than two separate levels. Overlapping levels don't double the significance; they confirm it.
Pro Tip: Mark no more than 2–3 higher-timeframe levels per instrument before a session. More than that and you'll find a reason to justify any trade, which defeats the purpose of the framework. For a deeper look at market structure trading, that guide covers BOS and CHOCH in detail.
Which indicators confirm top-down alignment without adding noise?
Indicators are secondary to structure. That's the rule. Use them to confirm what price is already telling you, not to generate signals independently. Indicator selection should prioritize the higher-timeframe signal; momentum and volatility measures help you size stops and judge trade feasibility rather than time exact entries.
| Indicator | Role in the top-down flow | Cross-timeframe interpretation |
|---|---|---|
| 50/200 EMA | Trend confirmation (macro level) | Both sloping same direction = strong bias |
| RSI | Momentum check (setup level) | Divergence on 4H warns of weakening trend |
| MACD | Momentum confirmation (setup level) | Histogram shrinking = momentum fading |
| ATR | Volatility / stop sizing (all levels) | Higher ATR = wider stops, smaller size |
| Bollinger Bands | Volatility squeeze detection | Band squeeze often precedes breakout |
| Volume | Confirmation at key levels | High volume at S/R = institutional interest |
Indicators that create noise on lower timeframes:
- Stochastic oscillator on a 1M or 3M chart generates so many crossovers that it's essentially random. Reserve it for the setup timeframe at minimum.
- Ichimoku Cloud is genuinely useful on daily and 4H charts but becomes cluttered and hard to read below 15 minutes.
- MACD on a 1M chart will whipsaw constantly during news-driven volatility. Use it on the setup timeframe only.
Combining indicators with price action:
A rejection wick at a higher-timeframe demand zone, combined with RSI divergence on the 4H and an ATR that confirms the stop distance is manageable, is a high-quality confluence signal. No single indicator triggers the trade; the combination confirms what structure already suggested. An engulfing candle at a key level with above-average volume is more meaningful than any oscillator reading in isolation.
What is the exact pre-trade workflow you should run every time?
This is the checklist. Run it in order before every trade, without skipping steps.
- Scan the macro timeframe (Daily/Weekly). Identify the dominant trend direction. Mark the 2–3 most relevant structural levels. Note whether price is in a premium (above equilibrium) or discount (below equilibrium) zone.
- Check the setup timeframe (4H/1H). Is price approaching a higher-timeframe level? Is there an order block, demand zone, or fair value gap that aligns with the macro level? If yes, the trade is worth watching. If no, move to the next instrument.
- Assess momentum and volatility. Check RSI on the setup timeframe for divergence. Note ATR on the daily to establish a realistic stop distance.
- Set your stop and calculate position size before looking at the entry timeframe. Stop goes at the logical invalidation level (below the demand zone, above the supply zone). Never set a stop based on how much you're willing to lose and then work backward to a zone.
- Drop to the execution timeframe (15M/5M). Wait for a trigger: BOS in the trade direction, rejection wick, or engulfing candle at the zone.
- Execute only when all three timeframes align. Bias confirmed on macro, location confirmed on setup, trigger confirmed on execution.
- Set target at the next higher-timeframe level in the direction of the trade. Don't set targets based on round numbers or arbitrary R-multiples unless they align with structure.
Position sizing template
The formula is the same whether you're trading forex lots or futures contracts:
Risk per trade = Account size × Risk %
For a $25,000 account risking 1% per trade: risk = $250.
Forex lot size: Risk ÷ (Stop distance in pips × Pip value per lot)
Example: $250 ÷ (20 pips × $10/pip for a standard EUR/USD lot) = 1.25 lots. Round down to 1 lot.
Futures contract size: Risk ÷ (Stop distance in ticks × Tick value)
Example for ES (S&P 500 E-mini): $250 ÷ (8 ticks × $12.50/tick) = 2.5 contracts. Round down to 2.
Correlation risk rule: If you're holding a long EUR/USD and you want to add a long GBP/USD, recognize that both pairs are highly correlated with USD weakness. Treat them as a single position for risk purposes and halve your size on the second trade.
A worked example: applying the workflow to EUR/USD
Instrument: EUR/USD | Session: New York open
Step 1 — Daily chart (macro bias). Price has been making higher highs and higher lows for three weeks. The 50 EMA is sloping upward and price is trading above it. Bias: bullish. The nearest higher-timeframe demand zone sits between 1.0820 and 1.0840, formed by a prior consolidation before a strong impulsive move higher.
Step 2 — 4H chart (setup location). Price has pulled back from recent highs and is now approaching the 1.0820–1.0840 zone. A 4H order block sits at 1.0835. RSI on the 4H is at 42, not yet oversold but showing the pullback has momentum. The zone is valid and aligns with the daily demand area.

Step 3 — 15M chart (execution trigger). Price taps 1.0832, produces a rejection wick, and then breaks the prior 15M swing high at 1.0845. That BOS on the 15M is the trigger.
Step 4 — Trade parameters.
| Parameter | Value |
|---|---|
| Entry | 1.0845 (above BOS candle close) |
| Stop | 1.0820 (below demand zone low) |
| Stop distance | 30 pips |
| Risk/Reward | 1:3 |
| Account risk | 1% of $25,000 = $250 |
Alternative decisions:
- If price reaches 1.0900 (halfway to target), a partial scale-out of 50% locks in profit and moves the stop to breakeven on the remainder. This reduces the R/R on the full position but eliminates the risk of a full reversal.
- If price closes a 4H candle below 1.0820 before triggering, the zone is invalidated. Stand aside. The daily bias may still be bullish, but the specific setup is gone.
Pro Tip: The stand-aside decision is a trade outcome, not a failure. Record it in your journal the same way you'd record an executed trade. Over time, your stand-aside decisions will tell you as much about your process as your entries do.
What mistakes do traders make, and how do you fix them with journaling?
The most common failure in top-down execution isn't a lack of knowledge. It's a process breakdown under pressure.
Common mistakes:
- Starting on the entry timeframe. You see a clean 5M setup and work backward to justify it. The daily chart is at resistance, but you rationalize it. This is the single most expensive habit in top-down trading.
- Buying into premium, selling into discount. ICT-style top-down workflows emphasize this explicitly: buy from discount zones (below equilibrium), sell from premium zones (above equilibrium). Ignoring this means you're entering at the worst possible location relative to higher-timeframe structure.
- Over-sizing after a losing streak. Revenge sizing is the fastest way to turn a manageable drawdown into an account-threatening one.
- Treating every higher-timeframe level as equally valid. A level that's been tested four times is weaker than one that's been tested once. Liquidity has been absorbed.
Journaling fields that actually improve behavior (drawn from ColibriTrader's framework):
- Pre-trade bias (what the daily chart said)
- Setup timeframe zone (where you expected price to react)
- Trigger type (BOS, rejection wick, engulfing)
- Emotional state at entry (calm, impatient, FOMO)
- Deviation from plan (yes/no — and if yes, what changed)
- Timeframe of decisive invalidation on losing trades
That last field is the one most traders skip. When you lose, record which timeframe gave the false signal. Over 20–30 trades, a pattern will emerge. Maybe your 15M triggers are failing because you're not waiting for a full candle close. Maybe your 4H zones are too wide. The journal surfaces that.
Pro Tip: After every losing trade, ask one question before closing the journal: "Which timeframe had the decisive invalidation?" Write the answer in a dedicated field. After 30 trades, you'll have a map of your actual weak points, not the ones you assumed.
How do you set up a multi-timeframe workspace that saves time?
A disorganized workspace is a behavioral risk. If you have to manually switch timeframes and re-draw levels every session, you'll cut corners under pressure.
- Build a three-chart template — Most platforms used by forex and futures traders (TradingView, NinjaTrader, Sierra Chart, Thinkorswim) support linked chart layouts. Set up three panels: macro, setup, and execution timeframes. Link them with synchronized crosshairs so clicking a level on the daily highlights the same price on the 15M.
Pro Tip: Save a "news session" template that adds an economic calendar overlay and widens your ATR-based stop multiplier by 1.5x. High-impact news events expand ranges unpredictably, and your standard stop distances will get hit before the real move begins.
How do volume profile and order flow fit into multi-timeframe analysis?
Volume profile and order flow data add a layer of precision that pure price-action analysis can't provide on its own. Where standard support/resistance tells you where price reacted, volume profile tells you why it reacted there.
Volume Profile on the macro and setup timeframes:
The Point of Control (POC) is the price level with the highest traded volume over a given period. Price tends to gravitate toward the POC and struggle to move cleanly through high-volume nodes. When your higher-timeframe demand zone aligns with a high-volume node on the volume profile, that's a stronger location than a zone identified by price action alone. Value Area High (VAH) and Value Area Low (VAL) act as natural targets and support/resistance boundaries.
On the setup timeframe, a low-volume node between two high-volume areas signals a price range where the market moved quickly and left little acceptance. These gaps tend to fill when price revisits them, making them useful targets.
Order flow on the execution timeframe:
Order flow tools (footprint charts, delta analysis) show the imbalance between buying and selling pressure at specific price levels. A high delta reading at your demand zone, meaning aggressive buyers stepped in, confirms the zone is holding. A negative delta at resistance confirms sellers are active. For futures traders on instruments like the ES, NQ, or CL, order flow data is available through platforms like Sierra Chart and NinjaTrader.
The practical rule: use volume profile to validate your higher-timeframe zones, and use order flow to confirm your execution-timeframe trigger. Don't reverse that order. Order flow on a 1M chart without higher-timeframe context is noise.
How do you integrate news events and the economic calendar into the top-down process?
News events don't override your top-down framework. They modify the risk parameters around it.
The economic calendar is a pre-session tool, not a mid-session one. Before you build your watchlist for the day, check for high-impact events: FOMC decisions, Non-Farm Payrolls, CPI releases, and central bank speeches. These events create volatility spikes that can blow through higher-timeframe levels that would otherwise hold. The top-down investing framework starts with macroeconomic factors precisely because they set the context for everything below them.
Practical rules for news integration:
- 30 minutes before a high-impact event: Close any open positions that are near their target or that have thin profit cushions. The risk of a spike reversal outweighs the potential gain.
- During the event: Stand aside entirely unless you're specifically trading the news reaction, which requires a different framework than top-down structure analysis.
- 15–30 minutes after the event: Wait for the initial spike to resolve and for price to show a clear directional commitment before re-entering. The first candle after a major release is often a trap.
- Adjust stop distances on news days. ATR expands significantly around high-impact events. A stop sized for normal volatility will get hit by the noise before the real move develops. Use 1.5–2x your standard ATR-based stop on days with scheduled high-impact releases.
For forex traders, central bank policy divergence is the macro driver that shapes weekly and monthly bias. When the Fed is hiking and the ECB is on hold, the USD has a structural tailwind that your daily chart will reflect. That's the top-down approach trading at its most fundamental level: macro policy sets the bias, structure confirms it, and your checklist finds the entry.
Key Takeaways
Top-down analysis trading works because it forces you to read market context from the highest timeframe first, so your entries align with structure rather than fight it.
| Point | Details |
|---|---|
| Three timeframes, three jobs | Macro sets bias, setup timeframe identifies the zone, execution timeframe provides the trigger. |
| Never start on the entry timeframe | Starting on the 5M or 15M chart without a daily bias is the single most common cause of false-breakout losses. |
| Size to ATR and portfolio risk | Calculate stop distance from ATR on the setup timeframe, then size the position so the stop equals 1% of account. |
| News events modify risk, not the framework | Widen ATR-based stops by 1.5–2x on high-impact event days; stand aside during the release itself. |
| Disciplineaiapp automates the checklist | The platform scans multi-timeframe alignment, generates confidence-scored setups, and logs trades automatically so the workflow runs without manual chart-switching. |
Why most traders get top-down analysis wrong
The method is simple. The execution is where traders consistently fail, and the reason is almost never analytical. It's behavioral.
Most traders understand the pyramid. They know the daily chart sets bias and the 5M chart provides the trigger. What they do in practice is the opposite: they find an attractive 5M setup and then scan higher timeframes looking for permission. That's bottom-up thinking dressed in top-down language, and it produces exactly the results you'd expect.
The other underrated failure is treating the three-timeframe framework as a one-time check rather than a continuous process. Market structure shifts. A daily chart that was bullish at 9 AM can produce a CHOCH by 2 PM after a major news event. Traders who set their bias in the morning and don't reassess it are operating on stale context.
What actually separates traders who use this method effectively from those who don't is the journaling habit described earlier. Specifically, recording which timeframe produced the decisive invalidation on losing trades. That one field, tracked over 30 trades, will show you exactly where your process breaks down. Not where you think it breaks down. Where it actually does.
The behavioral pattern tracking side of trading is where the real edge lives. Technical analysis gives you a framework. Behavioral consistency is what lets you execute it.
Disciplineaiapp puts the top-down checklist on autopilot
Running a full top-down scan manually across multiple instruments and timeframes takes 20–30 minutes before every session. That's time most traders don't have, and the manual process introduces the exact behavioral errors this guide warns against: confirmation bias, skipped steps, and rushed entries.

Disciplineaiapp handles the multi-timeframe alignment scan automatically. The platform monitors market structure, trend conditions, and liquidity events across timeframes simultaneously, then surfaces AI-generated trade setups with confidence scores so you see which setups have the strongest cross-timeframe alignment before you open a single chart. Position sizing is built in: enter your account size and risk percentage, and the calculator outputs the correct lot or contract size for the stop distance the setup requires. Every trade is logged automatically with the fields that matter for behavioral improvement: timeframe of entry, trigger type, and deviation from plan.
The result is the workflow from this guide, running continuously in the background, without the manual overhead. See the full feature set and start a free trial on iOS or Android.
Further reading and useful sources
These are the sources worth bookmarking if you want to go deeper on specific parts of the top-down framework:
- NinjaTrader: Top-Down Analysis for Futures Trading — The clearest explanation of the three-layer pyramid applied specifically to futures instruments. Start here if you trade ES, NQ, or CL.
- InnerCircleTrader: ICT Top-Down Analysis — Detailed walkthrough of the ICT-style Daily → H4 → H1 → M15 workflow, including premium/discount checks and market structure shift rules.
- TradingFinder: Higher to Lower Timeframe Trading — Practical guide to marking order blocks, fair value gaps, and key S/R levels across timeframes. Useful for the zone-identification step.
- Investopedia: Top-Down Investing — Explains the macro-to-specific logic that underpins the entire approach, including how central bank policy and GDP data filter down to individual instruments.
- Investopedia: Top-Down vs. Bottom-Up — A clean comparison of both approaches and when each is appropriate. Useful for traders who want to understand when bottom-up checks add value.
- IG: Top 10 Trading Indicators — Reference guide for the indicators covered in this article (MA, RSI, MACD, ATR, Bollinger Bands). Useful for understanding default settings and typical applications.
- ColibriTrader: Top-Down Analysis Practical Guide — Strong on the behavioral side: explains why lower-timeframe signals fail without higher-timeframe context and offers practical workflow steps to avoid that mistake.
- MQL5: Multi-Timeframe Market Structure — Technical breakdown of how timeframe structures interact and why a clean uptrend on M15 is often just a pullback inside an H4 downtrend.
For putting this framework into practice with automated scanning and journaling, the Disciplineaiapp learning center and AI trade analysis resources walk through how the platform applies these concepts in live market conditions.