
For active traders who need real-time, multi-exchange liquidation visibility with integrated market-structure context, Disciplineaiapp is the strongest choice available today. It combines low-latency WebSocket feeds, AI-generated trade setups, and behavioral risk controls that standalone dashboards simply don't offer.
Three reasons it stands out:
- Real-time cross-exchange feeds with WebSocket latency, covering major derivatives venues and on-chain perpetuals
- Integrated market-structure and volatility context that ties liquidation events to actual trade setups and confidence scores
- Alerting and API access for automation, so you're not watching a screen 24/7
Ready to see it in action? Explore Discipline AI's features and start a free trial directly from the app.
Table of Contents
- What does a liquidation heatmap actually show you?
- Real-time feeds and totals: which metrics actually matter
- Why exchange coverage determines whether your data is trustworthy
- What historical liquidation charts tell you about market structure
- How professional traders actually use liquidation signals
- What to look for when evaluating any liquidation tracker
- Common limitations and how to avoid getting burned by bad data
- Why Disciplineaiapp is the recommended choice for liquidation tracking
- What liquidation trackers actually cost in the US market
- Security and privacy considerations for liquidation trackers
- Regulatory and legal considerations for US traders
- Key Takeaways
- The gap between watching liquidations and trading them well
- Disciplineaiapp brings liquidation data into a full trading workflow
- Useful sources and further reading
What does a liquidation heatmap actually show you?
A liquidation heatmap aggregates forced-close events by price level, sizing each block by the dollar value liquidated at that level. Real-time heatmaps typically color long liquidations red and short liquidations green, so you can see at a glance which side of the market is getting squeezed and where the pressure is densest.

The timeframe toggles matter more than most traders realize. A 1h view reveals active cascades in progress. A 4h view shows whether a cluster is building or dissipating. The 12h and 24h views expose baseline churn versus genuine structural pressure. Switching between them tells you whether you're looking at a one-candle event or a sustained forced-close cycle.
Heatmaps also pair with liquidation pressure indicators, which summarize how much fuel sits on either side by distance bands from the current price. The heatmap tells you where liquidations concentrated; the pressure indicator tells you how much remains loaded on each side.
Pro Tip: Compare the 1h heatmap cluster against the same-period candle structure. If a dense long-liquidation zone aligns with a wick low and a bullish engulfing candle, that's a confluence worth tracking. If the candle is still falling into the cluster, the cascade may not be exhausted yet.
Real-time feeds and totals: which metrics actually matter
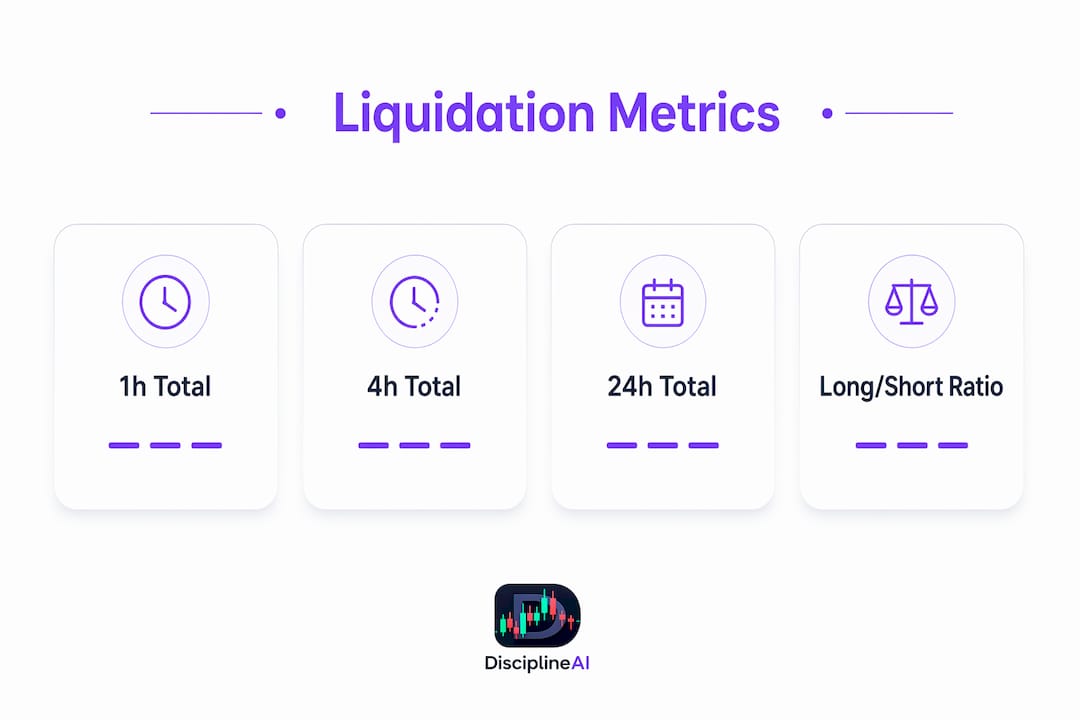
The core metrics every serious tracker should expose are: 1h, 4h, 12h, and 24h liquidation totals; long/short ratio; open interest (OI); funding rate; and a tick-level event feed. Miss any one of these and you're flying partially blind.

Latency is where trackers diverge sharply. WebSocket event feeds record each forced close as it happens, with sub-second delivery. Polled APIs check at intervals, so they can miss bursts. Model-based OI estimates are the weakest option: they infer liquidations from position-size changes rather than recording actual events, and they can mislead badly during extreme volatility when margin buffers vary widely across users and exchanges.
| Metric | What a spike typically signals | Suggested trader action |
|---|---|---|
| 1h liquidation total | Active cascade underway | Reduce size; wait for exhaustion |
| Long/short ratio (imbalanced) | Forced sell-off or short squeeze | Confirm with OI direction before entry |
| Open interest (rising) | New money entering; cascade may continue | Widen stops or stand aside |
| Funding rate (extreme) | Crowded side about to get squeezed | Fade with caution; use tight stops |
| 24h rolling total | Structural context for the session | Calibrate position sizing baseline |
A sudden 1h spike with flat 24h totals usually means a localized cascade, not a trend shift. A steady rise across all timeframes suggests sustained forced liquidation, which often precedes a more durable move.
Why exchange coverage determines whether your data is trustworthy
Not all liquidation data is created equal, and the gap between CEX feeds and on-chain DEX data is significant. CEX venues often sample or aggregate their public liquidation streams, especially during high-volume bursts. On-chain perpetual venues publish every event on-chain, making their feeds fully auditable and complete.
For US traders specifically, exchange coverage carries an extra layer of complexity. Several high-volume derivatives venues restrict US-based accounts due to KYC and geo-compliance requirements. Before you build a workflow around any tracker's feed, verify that the underlying exchange API is accessible from the US and that the data isn't geo-filtered at the source.
Broad coverage matters because liquidation pressure is rarely confined to one venue. A cascade that starts on one major exchange can propagate across others within seconds. A tracker pulling from only two or three CEXs will undercount the event and potentially misread its severity.
What historical liquidation charts tell you about market structure
Historical views are where liquidation data shifts from reactive to strategic. Time-series charts of long and short liquidations let you compare the current session against prior events of similar magnitude. The largest single-day events on record serve as benchmarks: if today's 24h total is approaching a historically extreme level, that's a structural signal, not just noise.
Useful chart types include spike charts (raw liquidation volume over time), rolling-window heatmaps (showing how pressure zones shift across sessions), and event timelines (per-coin histories that reveal which assets are most frequently liquidated during broad market stress).
What top liquidation events tell you:
- Exhaustion signals: When a single session records an extreme long-liquidation total, the forced selling is often near its end. Price frequently reverses sharply within hours.
- Liquidity entry points: Clusters of historical liquidations at a price level suggest that level has acted as a magnet before and may again.
- Volatility windows: The sessions following major liquidation events tend to show elevated volatility for 24–72 hours, which affects position sizing and stop placement.
Pairing historical data with liquidity sweep strategies gives you a framework for planning entries around known liquidation zones rather than reacting to them after the fact.
How professional traders actually use liquidation signals
The workflow that separates disciplined traders from reactive ones has five steps, and skipping any of them increases the odds of entering a cascade mid-move rather than after exhaustion.
- Detect the 1h spike on the heatmap. A sudden cluster of long liquidations at a specific price level is the trigger to pay attention, not to act.
- Check the exchange breakdown and confirm with OI and funding. If OI is rising alongside the spike, new positions are entering, and the cascade may continue. If OI is falling, the forced closes are unwinding existing exposure.
- Confirm with price action and market structure. A liquidation spike without a corresponding structural signal (support level, volume node, or trend inflection) is noise. Wait for both.
- Size conservatively or set alerts. If the signal is confirmed, size down from your normal position and set an alert for the next timeframe's close rather than entering immediately.
- Execute or stand aside. If the confirmation isn't clean, stand aside. Missing a trade costs nothing; entering a cascade mid-move can be expensive.
Pro Tip: A true cascade shows three things simultaneously: a high imbalance in the long/short ratio (90%+ on one side), rising OI, and a funding rate skewed heavily toward the liquidated side. Two out of three is a caution signal. All three together is when the setup becomes worth sizing.
Crypto risk management principles apply directly here: keep leverage below the level where a 5% adverse move triggers your own liquidation, use stops placed beyond the liquidation cluster rather than inside it, and consider a protective hedge when OI is rising into a confirmed cascade.
What to look for when evaluating any liquidation tracker
Use this checklist before committing to any tool. The minimum expectation column tells you what's acceptable versus what's a red flag.
| Feature | Minimum expectation | Why it matters |
|---|---|---|
| Real-time WebSocket feed | Sub-second event delivery | Polled feeds miss cascade bursts |
| Exchange coverage | major derivatives venues + on-chain | Narrow coverage undercounts severity |
| Long/short breakdown | Per-event and aggregated | Ratio reveals forced-sell vs squeeze |
| OI & funding visibility | Live, not modeled | Model estimates mislead in volatility |
| Timeframe toggles | 1h / 4h / 12h / 24h minimum | Context shifts dramatically by window |
| Alerting & mobile push | Configurable thresholds, push delivery | You can't watch screens continuously |
| API access & export | Documented endpoints, rate limits stated | Required for automation and backtests |
| Data provenance | Source exchanges named, methodology documented | Unattributed data is unverifiable |
| Pricing model | Free tier or trial available | Evaluate before committing |
Professional trackers expose all of these as standard. If a tool hides its data sources or doesn't document its API, treat that as a hard disqualifier.
Common limitations and how to avoid getting burned by bad data
Every liquidation tracker has blind spots. Knowing them prevents costly misreads.
- Public-feed sampling: Many CEX public streams cap or aggregate events during bursts. Reported totals can substantially understate true liquidations in extreme sell-offs.
- Exchange API rate limits: During high-volatility periods, exchange APIs throttle connections. A tracker that doesn't handle reconnection gracefully will show gaps in the feed.
- Model-based OI estimates: These infer liquidations from position changes rather than recording actual events. They're useful for context but unreliable for precise timing.
- DEX vs CEX reporting differences: On-chain venues record every event; CEX venues may not. Comparing raw totals across venue types without accounting for this creates false imbalances.
- Asset and timezone blind spots: Some trackers cover only BTC and ETH, or only a subset of trading pairs. Check coverage before relying on a feed for altcoin positions.
Practical mitigations: cross-check on-chain sources against CEX feeds when signals seem extreme, use multiple timeframes before acting, and default to conservative sizing whenever your primary signal comes from a sampled feed. Pairing liquidation data with volatility indicators adds a second confirmation layer that doesn't share the same data-quality risks.
US traders should also verify that any exchange API they integrate complies with applicable KYC and geo-access requirements before using it for live execution.
Why Disciplineaiapp is the recommended choice for liquidation tracking
Most standalone liquidation dashboards show you the data. Disciplineaiapp shows you what to do with it.
That's exactly the architecture Disciplineaiapp is built around. Real-time liquidation events feed into the platform's AI intelligence engine, which cross-references market structure, trend conditions, and volatility context to generate trade setups with confidence scores. You're not just seeing a spike on a heatmap; you're seeing whether that spike aligns with a high-probability setup or should be ignored.
The checklist match is direct: low-latency alerts, multi-timeframe toggle support, integrated OI and funding context, API access, and export capability. Beyond the data layer, Disciplineaiapp adds stand-aside protection (a behavioral guard that flags when you're about to trade a cascade from the wrong side) and position sizing guidance calibrated to the current volatility environment. That combination is what separates a data tool from a trading intelligence platform.
See how AI applies to liquidation signals and how the confidence scoring works before you commit to a workflow.
What liquidation trackers actually cost in the US market
Pricing across the tracker category ranges from free public dashboards to professional API subscriptions. Free tiers typically offer delayed data, limited exchange coverage, and no alerting. Mid-tier subscriptions add real-time feeds, mobile alerts, and basic API access. Enterprise tiers include full WebSocket access, higher rate limits, historical data exports, and priority support.
Disciplineaiapp operates on a subscription SaaS model available through iOS and Android app stores, with a free trial period that includes access to real-time signals, alerts, and core analytics. Pricing is not publicly listed beyond the app store pages; check current tiers directly in the app.
For US traders, the cost-benefit calculation should weight data reliability and latency heavily. A free tool with sampled feeds can cost more in bad trades than a paid subscription with verified event-level data.
Security and privacy considerations for liquidation trackers
Any tool that connects to your exchange accounts via API carries security risk. The minimum standard is read-only API keys with no withdrawal permissions. Never grant a third-party tracker write access to your exchange account.
Privacy policies vary significantly. Some platforms log your watchlist, alert configurations, and usage patterns for analytics. Before connecting any tracker to a live account, review what data the platform collects, how long it retains it, and whether it shares data with third parties. Platforms that don't publish a clear privacy policy are a risk.
Disciplineaiapp's mobile-first architecture means your trading data stays within the app's secure environment. For any platform you evaluate, confirm that API credentials are encrypted at rest and that the platform has a documented incident response process.
Regulatory and legal considerations for US traders
US traders face a specific regulatory environment that affects which exchange feeds and platforms are accessible. Several major derivatives exchanges restrict US-based accounts under CFTC and FinCEN guidelines, which means some liquidation data feeds may be geo-restricted or require VPN use that itself carries legal risk.
Using a liquidation tracker that pulls data from exchanges you cannot legally access does not create legal liability for viewing the data, but building automated trading strategies that execute on those exchanges may. Consult a qualified legal or compliance professional for your specific situation before integrating any exchange API into a live trading system.
This article is general information, not legal or financial advice. Verify current regulatory requirements with a qualified professional before making decisions based on exchange access or API integration.
Key Takeaways
The most reliable liquidation trackers combine low-latency WebSocket event feeds with multi-timeframe context, exchange breadth, and integrated risk controls — standalone dashboards that lack these elements will consistently undercount cascades and misread severity.
| Point | Details |
|---|---|
| Prioritize event feeds over models | WebSocket event feeds record actual force-closes; model-based OI estimates mislead during volatility bursts. |
| Verify exchange coverage | Expect major derivatives venues plus on-chain perpetuals; narrow coverage undercounts cascade severity. |
| Combine signals, don't act on one | Confirm liquidation spikes with OI direction, funding rate, and price-action structure before sizing a position. |
| Use historical data for sizing | Cross-check current spikes against historical events to set stop width and assess whether a move is a sweep or trend shift. |
| Disciplineaiapp adds trade context | Beyond raw data, Disciplineaiapp ties liquidation events to AI-generated setups, confidence scores, and stand-aside protection. |
The gap between watching liquidations and trading them well
Most traders who discover liquidation trackers make the same mistake: they treat a spike as an entry signal. It isn't. A spike tells you that forced closes happened. It says nothing about whether the cascade is finished, whether new money is entering, or whether the move has structural support.
The traders who use this data well treat it as one layer of a multi-factor confirmation stack. They watch the 1h heatmap for the initial signal, check OI and funding to judge continuation risk, and only act when price structure confirms what the liquidation data implies. When those three things don't align, they stand aside. That discipline, more than any specific tool, is what separates consistent traders from reactive ones.
The other underappreciated point: data quality varies enormously across trackers, and most traders never check it. A sampled CEX feed during a major cascade can underreport true liquidation volume significantly, which makes the event look smaller than it is and leads to undersized stops and premature entries. Verifying your tracker's data provenance isn't optional; it's part of the edge.
Disciplineaiapp brings liquidation data into a full trading workflow
Raw liquidation dashboards show you the event. Disciplineaiapp shows you the trade.

The platform's real-time intelligence engine connects liquidation events, market structure, volatility conditions, and AI confidence scoring into a single workflow. You get configurable alerts, position sizing guidance, stand-aside protection, and a trade journal that tracks how your liquidation-based setups actually perform over time. That feedback loop is what most standalone trackers cannot offer.
Trial access includes the real-time signals dashboard, mobile push alerts, and core analytics. Start your free trial through the iOS or Android app, or visit the Discipline AI learning center to see how the platform maps to your current workflow before you commit.
Useful sources and further reading
| Source | What it provides | Best for |
|---|---|---|
| TRADER.PRO Liquidations | Live WebSocket feed from multiple exchanges; cascade pulse chart; per-coin and per-exchange 24h breakdown | Traders wanting a free real-time dashboard with documented data sources |
| CoinMarketCap Liquidations Dashboard | Long/short totals, historical data, largest single-day events | Traders needing historical context and broad asset coverage |
| Quantority Liquidations | Metric definitions, imbalance interpretation, API vs model comparison | Developers and traders building automated workflows |
| Datawallet Crypto Liquidations | CEX vs DEX feed comparison; undercounting analysis | Traders evaluating data quality and provenance |
| TRdesk Liquidation Heatmap | Heatmap construction, color semantics, pressure indicator methodology | Traders learning to read heatmaps and pressure indicators |
| CoinPerps Liquidations | Feature benchmarks for professional trackers; historical spike charts | Traders comparing tracker feature sets |
| Crypto Data API Liquidations | Cascade dynamics, reversal signal interpretation | Traders building cascade-detection logic |