
The single best way to avoid false breakouts is to demand confirmation before you commit capital: a volume spike above the recent average, a candle that closes beyond the level rather than just poking through it, and at least one confluence factor like trend or session context. Pair that filter with a preference for retests over impulse entries, and let a tool like Discipline AI enforce the rule when emotion tries to override it. The rest of this guide shows you how to measure each piece and calibrate it to what you actually trade.
TL;DR:
- Confirm breakouts only with volume at least double the average; weak volume suggests a false move.
- Wait for candles to close beyond the level and look for confluence with higher timeframes or events to avoid traps.
- Prioritize retests and follow-through candles over impulse entries, scaling in gradually and avoiding early trades within the first 15 minutes.
- Calibrate momentum indicators like RSI and MACD based on the asset's cycle length to improve signal accuracy and reduce noise.
- Resist the urge to trade during thin volume periods, such as midday or after major releases, and enforce strict stop and position sizing rules.
Table of Contents
- What Is the 3-Point Checklist for Avoiding False Breakouts?
- How Do You Time Entries to Reduce Breakout Traps?
- How Do You Calibrate RSI and MACD to Cut False Signals?
- How Should Timeframe and Time of Day Affect Your Breakout Trades?
- What Stop, Size, and Journaling Rules Limit False-Breakout Losses?
- How Discipline and Data Reduce False-Breakout Losses
- Why Do So Many Breakout Traders Get Trapped by the Same Setups?
- How Do You Tell a Real Breakout From a Fake One Using Price Action Alone?
- Where Do False Breakouts Happen Most Often?
- A Trader's Take on Patience and Missed Trades
- Enforce Your Breakout Rules Automatically With Discipline AI
- Where to Learn More About Testing and Calibration
- Sources
What Is the 3-Point Checklist for Avoiding False Breakouts?
A breakout without volume is a suggestion, not a signal. Practitioner frameworks consistently point to the same three filters before you treat a level break as real: volume confirmation, a closed candle beyond the level, and contextual confluence. Skip any one of them and you're trading hope.

Volume. Set a baseline using the average volume of the prior candles on your timeframe. A breakout candle printing noticeably less than double that baseline is weak evidence. Well above baseline suggests real participation, not a handful of stop orders getting triggered.
Candle close. Wait for the candle to close beyond the level, not just wick through it. A long upper wick with a close back inside the range is a rejection, not a breakout, and it's often the clearest tell you'll get all day. Intraday traders can use a 5 or 15 minute close as a faster proxy, but the same logic applies: the close matters more than the touch.
Confluence. A breakout that agrees with the higher timeframe trend, sits near a sector-wide move, or coincides with a scheduled catalyst (earnings, a rate decision, a major economic print) carries more weight than one that happens in isolation on light news. A breakout against the daily trend, on quiet volume, during a news vacuum, is the profile of a trap.
Why do so many breakouts fail this test? Large players frequently push price just past an obvious level to trigger stop orders and pending entries before reversing, a pattern often called a liquidity grab. Volume and confluence are what separate a genuine shift in supply and demand from a hunt for easy liquidity.
That's three failed checks out of three. Skip it.
Pro Tip: Write your volume and confluence rules down as fixed thresholds before you look at a single chart today. Deciding "what counts" in the moment is exactly when confirmation bias creeps in.
How Do You Time Entries to Reduce Breakout Traps?
Confirmation tells you whether a breakout is real. Entry mechanics determine whether you get trapped anyway. Here's a practical sequence:
- Wait for the retest. After a confirmed breakout, price frequently pulls back to retest the broken level before continuing. Entering on that retest, with a stop just below the level, gives you a tighter risk profile than chasing the initial move. Waiting for a retest or a closed candle is one of the more reliable ways to sidestep the initial poke that traps early entrants.
- Require a follow-through candle. If you can't wait for a retest, at minimum wait for the candle after the breakout candle to also close in the direction of the move, ideally with an indicator like RSI or MACD agreeing on momentum.
- Scale in rather than going all in. Take a partial position on confirmation, add on the retest hold, and add again only if momentum indicators stay aligned. This kills the FOMO-driven urge to load up the instant a level breaks.
- Skip the first five minutes of a session. Early-session volume is often erratic and unrepresentative of real intent; breakouts minutes after the open fail more often than ones that hold into the first 30 minutes.
Pro Tip: If you find yourself entering before the candle closes "just to not miss it," that's the single most common leak in a breakout trader's process. Log it every time it happens for a month and watch the pattern.
How Do You Calibrate RSI and MACD to Cut False Signals?
Generic indicator settings (14-period RSI, 12/26/9 MACD) get applied to every asset by default, and that's a mistake. Calibrating indicators to the instrument's actual price cycle measurably tightens the signal-to-noise ratio.
Start by identifying the asset's dominant cycle length using swing pivots or a ZigZag indicator on your chosen timeframe. Count the average number of candles between major swing highs and lows over the last 20 to 30 cycles. From there, simple derived formulas work well as a starting point:
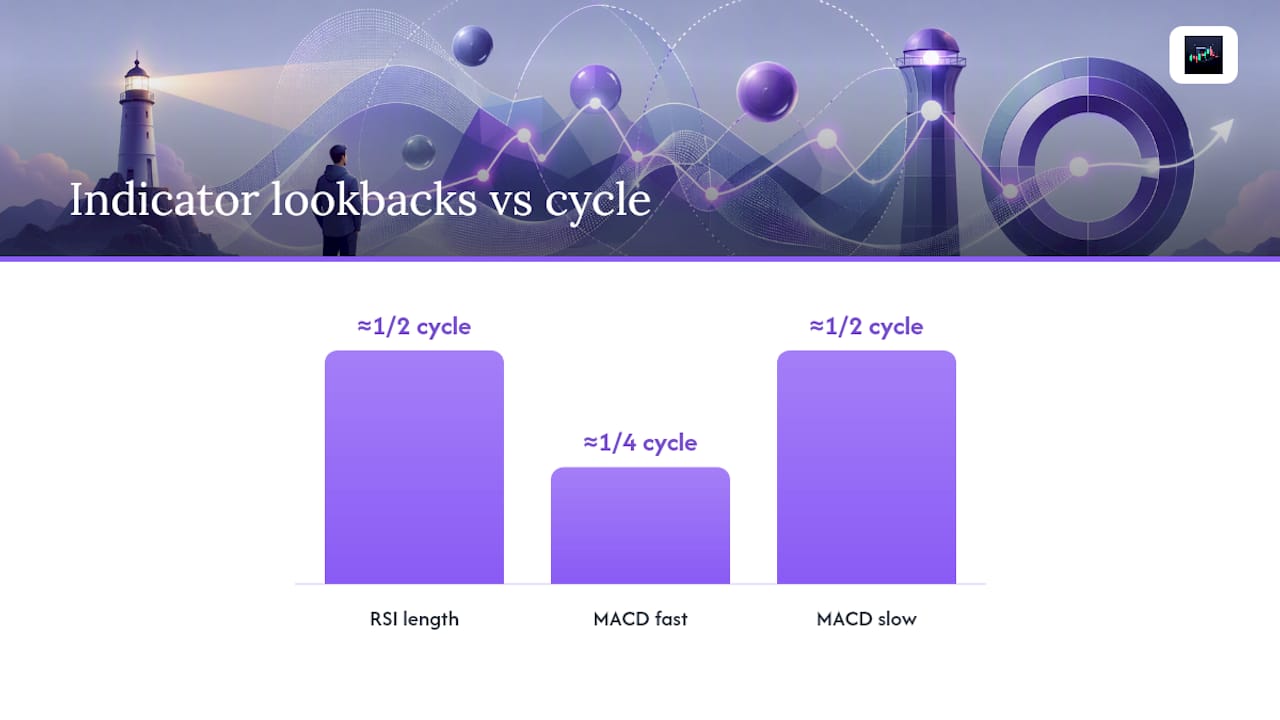
- Set RSI length to roughly half the measured cycle length.
- Set MACD's fast period to roughly one-quarter of the cycle and the slow period to roughly one-half.
- Keep volume moving averages tied to the same lookback window you used for your breakout confirmation rule, so every filter is measuring the same rhythm.
If a setting looks great in training but falls apart in testing, you've overfit to noise, not signal. A structured reality-check process that plants known signals and pure noise into your test data is a stronger safeguard still, since it catches look-ahead bias that a simple split can miss.
Treat momentum divergence (price making a new high while RSI or MACD doesn't) as a filter that lowers your confidence in a breakout, not as a standalone trigger to fade it. Divergence without a broken structure is just noise.
How Should Timeframe and Time of Day Affect Your Breakout Trades?
A five-minute breakout that contradicts the daily trend is a different trade than one that confirms it, and treating them the same is how traders get chopped up in ranges that look like trends on a small screen.
- Prefer breakouts on your entry timeframe that align with the trend on the daily or 4-hour chart; a countertrend breakout needs stronger volume and confluence to earn a smaller position size, not the same size.
- A lower-timeframe breakout lacking higher-timeframe confirmation isn't automatically invalid, but it deserves a tighter stop and a smaller size, since you're betting against the larger structure.
- The first 15 to 30 minutes after the open often carries genuine volume but erratic direction; breakouts here need extra confirmation.
- The midday lull, roughly 12:00 to 1:30 PM in equity markets, sees thinner participation, and breakouts during that window fail more often simply because there isn't enough real volume behind them.
- After-hours and pre-market breakouts on lower-volume names can look dramatic on a chart and evaporate the moment regular trading hours resume.
What Stop, Size, and Journaling Rules Limit False-Breakout Losses?
Confirmation reduces how often you get trapped. Risk rules control how much a trap costs you when it happens anyway.
- Set stops based on structure, not round numbers. For a retest entry, place your stop just beyond the retest low or high. For a momentum-confirmed entry without a retest, use 1 to 1.5 times the Average True Range (ATR) beyond your entry as a volatility-adjusted buffer.
- Size positions off stop distance, not gut feel. If you risk 1% of account equity per trade and your stop is $2 away from entry, your position size is simply 1% of equity divided by $2 per share. Wider stops on volatile breakouts mean smaller size automatically.
- Use One-Cancels-the-Other (OCO) orders to set your stop and target simultaneously so a false breakout doesn't turn into a hesitation-driven bigger loss while you stare at the screen deciding what to do.
- Stand aside when your checklist doesn't fully confirm. No volume, no close, no confluence, no trade. That's a rule, not a suggestion.
Journal every breakout you take, along with the ones you skip. Track volume relative to baseline, time of day, indicator readings at entry, and the eventual outcome. Patterns in your own false-breakout log, not generic advice, will tell you which of your filters actually work.
Pro Tip: Journal your skipped setups as carefully as your taken trades. The breakouts you correctly avoided are the evidence that your checklist is working, and most traders never bother to track them.
How Discipline and Data Reduce False-Breakout Losses
A checklist only works if you follow it every time, and that's precisely where most breakout traders fall apart under pressure. Structured tools translate the same logic into something harder to override in the moment.
- A confidence score on a setup functions like an automated version of your volume and structure checks, giving you a number instead of a feeling.
- Trade autopsies after a loss let you see exactly which piece of your checklist was weak or missing, turning one bad trade into a calibration input rather than a mystery.
- Stand-aside protection enforces the "no trade" rule automatically when a setup's reliability score falls below your threshold, removing the moment where willpower usually fails.
- Ongoing journaling and performance analytics build the same pattern library described above, without you manually logging every field by hand.
Why Do So Many Breakout Traders Get Trapped by the Same Setups?
Most false breakouts aren't a checklist failure. They're a discipline failure that happens after the trader already knows the rule.
Fear of missing out is the biggest culprit. A level breaks, price starts moving, and the urge to get in before it "runs away" overrides the two or three minutes it would take to see whether the candle actually closes beyond the level. Confirmation bias runs a close second: once a trader has a directional bias on a stock or a pair, they'll see any move past a level as validation, ignoring thin volume or an obvious lack of confluence because the story already fits.
Revenge trading after a prior loss compounds the problem. A trader stopped out of a false breakout an hour ago is primed to jump on the next setup without the same scrutiny, trying to make the money back rather than evaluating the new trade on its own merits.
There's also a subtler mistake: treating every breakout the same regardless of context. A trader who applies one static rule set to a quiet range-bound stock and a high-beta momentum name during earnings season is going to get burned by one of them, because the volume and volatility baselines that make a breakout "confirmed" are completely different in each case. The checklist has to flex with the instrument, not stay frozen.
How Do You Tell a Real Breakout From a Fake One Using Price Action Alone?
Price action gives you clues before volume data or indicators even update, if you know what to watch for.
Wick behavior at the level is the fastest tell. A breakout candle with a small body and a long wick poking through resistance, then closing back inside the range, is a rejection candle. Multiple rejection wicks at the same level over a few sessions usually mean supply or demand is defending that price, and a breakout through it needs unusually strong participation to be trusted.
Speed of the retest matters more than most traders realize. A genuine breakout that holds tends to pull back to the broken level slowly, with shrinking momentum, before resuming. A false one often snaps back through the level almost immediately, sometimes within the same session, which is a sign the "breakout" was really just a temporary imbalance getting resolved.
Range contraction before the move adds credibility. Breakouts that emerge from a tightening range, several sessions of shrinking candle bodies, tend to be more reliable than breakouts that erupt out of already-choppy, wide-ranging price action, because contraction reflects genuine accumulation or distribution rather than random noise.
Failed retest of the opposite level is a confirming signal on the way out: if price breaks resistance, retests it as new support, and that support holds on a second test days later, the breakout has effectively been double confirmed by the market itself.
Where Do False Breakouts Happen Most Often?
Not every market punishes breakout traders equally. Some environments are simply thinner and more prone to manipulation than others.
Low-float and small-cap stocks see exaggerated false breakouts because a relatively small order can move price through a level without reflecting genuine broad demand. The same $500,000 order that barely dents a large-cap name can blast through resistance in a thinly traded small-cap and then evaporate.
Cryptocurrency markets, especially altcoins outside the top 20 by market capitalization, are notorious for false breakouts driven by concentrated holder activity and thinner order books during off-peak hours, particularly overnight in US time zones.
Forex pairs during low-liquidity sessions, like the gap between the New York close and the Tokyo open, see frequent false breakouts because the absence of major institutional flow lets smaller orders move price disproportionately.
Futures and index products around major economic releases whipsaw through key levels in the seconds after a report, often reversing within minutes once algorithmic reactions settle and human traders reassess. Waiting even five minutes past a scheduled release before evaluating a breakout in these instruments avoids a large share of the worst traps.
A Trader's Take on Patience and Missed Trades
The hardest part of this whole approach isn't learning the checklist. It's tolerating how often the checklist tells you to do nothing.
Every rule in this guide, the volume threshold, the closed candle, the retest, the confluence check, exists to slow you down at the exact moment your instincts are screaming to move fast. That's uncomfortable. Missed trades feel like losses even when they're not, and the trader who can sit through that discomfort without breaking the rule usually outperforms the one chasing every level break over a long enough stretch.
Testing and calibration matter, but they only pay off if you actually record what happens. Every false breakout you sit through and log is data. Review it monthly, and the same errors get harder to repeat.
— Tony
Enforce Your Breakout Rules Automatically With Discipline AI
Knowing the checklist and following it under pressure are two different skills, and the second one is where most traders lose money. Discipline AI scans markets across crypto, forex, and stocks for the same structural conditions covered here, volume behavior, trend alignment, liquidity events, and volatility, then attaches a confidence score to each setup so you're reacting to a number instead of an adrenaline spike.
When a trade doesn't hold up, the platform's AI trade autopsies break down exactly which confirmation piece was missing, turning a losing breakout into a calibration input instead of a mystery. Stand-aside protection steps in automatically when a setup's reliability falls below your threshold, enforcing the "no trade" rule even on the days your discipline is running thin. Automated journaling and performance analytics build the pattern library this guide recommends, without the manual spreadsheet work. If you're ready to put a checklist into practice instead of just remembering it, start with the Discipline AI app.
Where to Learn More About Testing and Calibration
For deeper work on validating a breakout edge before risking capital, review backtesting fundamentals, compare forward testing against backtesting, and study trend indicator selection for calibration groundwork.
Sources
- The Breakout vs. Fakeout Strategy: A Pro Trader's Checklist | DayTradingToolkit
- How to Identify False Breakouts for More Consistent Results
- Calibrating Trading Indicators for Different Markets for NASDAQ:AAPL by TradeVizion — TradingView
- A trust-first check for cross-sectional trading signals: does your edge survive the truth? (alethia)