
Backtesting checks whether a strategy had a statistical edge in historical data. Forward testing checks whether that edge survives real execution, real costs, and you as the trader. Run them in that order, and you have a genuine validation pipeline. Skip either one, and you are flying with instruments that only show half the picture.
The practical sequence: start with a rigorous backtest that includes an out-of-sample or walk-forward split, then run a disciplined forward test on live data (paper or demo) before touching real capital. Backtests can generate hundreds of trades in minutes; forward tests take months to accumulate comparable samples. That asymmetry is not a flaw in the process. It is exactly why both stages exist. The dominant failure mode in backtesting is overfitting. The dominant failure mode in forward testing is execution and behavioral breakdown. Neither test catches the other's blind spot.
Table of Contents
- What do backtesting and forward testing actually mean?
- What does each method actually validate?
- How to run a credible backtest
- How to run a disciplined forward test
- Backtesting vs forward testing: a direct comparison
- When should you use each method, and in what order?
- Common pitfalls and how to avoid them
- Which metrics should you track in both tests?
- A practical forward-test checklist you can use today
- Why behavioral measurement is the part most traders skip
- Key Takeaways
- The part nobody talks about honestly
- Disciplineaiapp makes the forward-test workflow measurable
- Useful sources and further reading
What do backtesting and forward testing actually mean?
Backtesting means running a fixed set of trading rules against historical price data to measure how the strategy would have performed. The data is already known, so the test runs fast and produces large trade samples quickly. Within a backtest, you split your data into an in-sample (IS) window used for development and an out-of-sample (OOS) window reserved for validation. The OOS window is never touched during parameter tuning; it is the honest performance check.
Walk-forward analysis (WFA) extends this by rolling the IS/OOS split across multiple periods, re-optimizing on each new IS window and validating on the next OOS slice. The result is a sequence of OOS results that shows whether the strategy degrades gracefully or collapses when market conditions shift. A walk-forward analysis guide covers the mechanics in detail if you want to go deeper on the methodology.
Forward testing runs the same frozen rules on real-time data, either in a paper/demo account or with micro live capital. Prices are live, timing is live, and fills reflect actual market conditions rather than modeled assumptions. Because the data has not been seen before, look-ahead bias is structurally impossible.
Common terminology and what each phrase implies about realism:
- Paper trading — simulated capital on a live data feed; zero financial risk, but emotional pressure is also near zero
- Forward testing — the umbrella term for any out-of-sample live-data test, paper or micro live
| Term | Data | Capital at risk | Emotional realism |
|---|---|---|---|
| Backtesting | Historical (IS + OOS) | None | None |
| Walk-forward analysis | Historical (rolling OOS) | None | None |
| Paper/demo trading | Live real-time | None | Low |
| Micro live | Live real-time | Small real amount | Moderate to high |
What does each method actually validate?
Backtesting answers one question: does this strategy have a statistical edge in historical data? It measures expectancy, win rate, profit factor, max drawdown, and Sharpe across hundreds or thousands of trades. It also reveals how sensitive the strategy is to parameter changes and whether performance holds across different market regimes. What it cannot detect is how you will behave when a losing streak hits, whether your broker's feed matches the data you tested on, or what slippage actually looks like at 9:31 AM on a news day.

Forward testing answers a different question: can this edge survive real execution and real trader behavior? Industry observation suggests forward testing typically reduces observed returns to a noticeably lower percentage of backtest results, with friction and behavioral deviation accounting for most of the gap. That is not a reason to distrust backtesting. It is a reason to treat the two stages as sequential filters rather than alternatives.
| Validation role | Backtesting | Forward testing |
|---|---|---|
| Statistical edge | ✓ Primary | ✗ Sample too small |
| Parameter sensitivity | ✓ Strong | ✗ Impractical |
| Regime behavior | ✓ With WFA | Partial |
| Execution quality | ✗ Modeled only | ✓ Primary |
| Real costs (spread, slippage) | ✗ Estimated | ✓ Measured directly |
| Trader discipline | ✗ Not applicable | ✓ Primary |
Pro Tip: Frame a pass/fail question for each stage before you start. For backtesting: "Does expectancy stay above 0.2R and within ±0.15R across all OOS windows?" For forward testing: "Does my live expectancy stay within 60–70% of the backtest figure over 60+ trades?" Vague criteria produce vague conclusions.
How to run a credible backtest
A backtest is only as reliable as the data and assumptions behind it. Sloppy inputs produce confident-looking numbers that fall apart the moment you go live.
Data sourcing and quality
Use tick data or high-resolution OHLCV data from a survivorship-free source. Survivorship bias inflates results because delisted or failed instruments disappear from most standard datasets. Align timestamps to UTC and check for missing ticks, duplicate bars, and corporate-action gaps. For prediction market or alternative data strategies, high-fidelity historical feeds with large snapshot counts matter enormously; large-scale historical data APIs can supply the depth needed for statistically meaningful backtests.
Simulation choices
Model commissions at the rates your broker actually charges. Exchange fees commonly run 0.1%–0.6% per trade depending on asset class and venue. Add spread modeling that reflects typical bid-ask widths for your instrument and time of day. Slippage assumptions should be conservative: use market-order fills with a realistic adverse-fill buffer rather than assuming mid-price execution. For limit orders, apply a partial-fill probability rather than assuming 100% fill.
Walk-forward and OOS procedures
Split your full dataset into IS and OOS before touching any parameters. A common split is 70% IS and 30% OOS, though the right ratio depends on how many trades each window produces. Freeze all parameters after IS optimization. Run OOS once. If OOS results diverge sharply from IS, the strategy is likely overfit. WFA rolls this process forward across multiple periods; consistent OOS performance across several windows is a much stronger signal than a single good OOS result.
Common checks
- Look-ahead bias: verify that no indicator or signal uses data from the current bar's close before that close is confirmed
- Outlier trades: identify any single trade that accounts for more than 20–25% of total profit; remove it and recheck expectancy
- Monte Carlo or bootstrap: shuffle trade order 1,000+ times to see the distribution of possible drawdowns
- Reproducibility: seed any random elements so results are identical on re-run
Pro Tip: Run your backtest on the exact calendar days you later forward test. Then compare signal counts. A divergence above roughly 5–10% between the backtest signal count and the forward-test signal count for the same days is a red flag for look-ahead bias, indicator repainting, or a data-feed mismatch.
Backtests can generate hundreds to thousands of trades in minutes, while a forward test on a swing strategy might produce only 20–30 trades per month. That sample-size gap is why the backtest carries the statistical burden and the forward test carries the execution burden.
How to run a disciplined forward test
The forward test is where strategy math meets reality. Its job is not to confirm the backtest. Its job is to expose every gap between what the rules say and what actually happens.
Setup
Use the exact data feed and execution environment your live account will use. Freeze all parameters and code before the window opens. Any change to the strategy during the forward window invalidates the test. If you discover a bug, document it, end the window, fix it, and restart.

Journaling discipline
Record every signal the strategy generates, whether you took it or not. For each trade, log: entry time, expected fill, actual fill, spread at entry, slippage in ticks or pips, exit time and price, P&L, and your emotional state at the moment of execution. Meticulous trade logging, including screenshots, rationale, and emotional state, is what separates a forward test that teaches you something from one that just burns time.
Sample-size planning
Minimum thresholds depend on trading frequency:
- 30 days / 30 trades — infrastructure sanity check: confirms the feed works, fills are executing, and the strategy generates signals as expected
- 60–90 days / 60–100 trades — execution parity check: enough data to compare live expectancy against backtest expectancy with reasonable confidence
- 90+ days / 100+ trades — behavioral stability check: long enough to encounter at least one losing streak and measure how discipline holds
Practical guidance recommends 30/30 as the minimum for a sanity check and 90/60–100 trades before moving to full sizing.
Transition staging
- Pass demo forward test (expectancy within 20% of backtest, rule-follow rate above 90%) → move to micro live
- Pass micro live (same criteria, 30+ trades) → scale to target position size
Pro Tip: To make paper trading emotionally meaningful, commit a small real amount to a separate account that mirrors your paper results dollar-for-dollar. You cannot replicate full live pressure in demo, but a financial proxy creates enough skin-in-the-game to surface behavioral tendencies that pure simulation hides.
Backtesting vs forward testing: a direct comparison
| Dimension | Backtesting | Forward testing |
|---|---|---|
| Data type | Historical (known) | Live real-time (unknown) |
| Time required | Hours to days | Weeks to months |
| Realism | Simulated fills | Live execution |
| Capital risk | None | None (demo) or small (micro live) |
| Costs and tools | Data subscription, backtest platform | Demo account (often free), journaling tool |
| Typical metrics | Expectancy, profit factor, Sharpe, max drawdown | Slippage, execution quality, rule-follow rate, live P&L |
| Primary failure mode | Overfitting, look-ahead bias | Execution breakdown, behavioral drift |
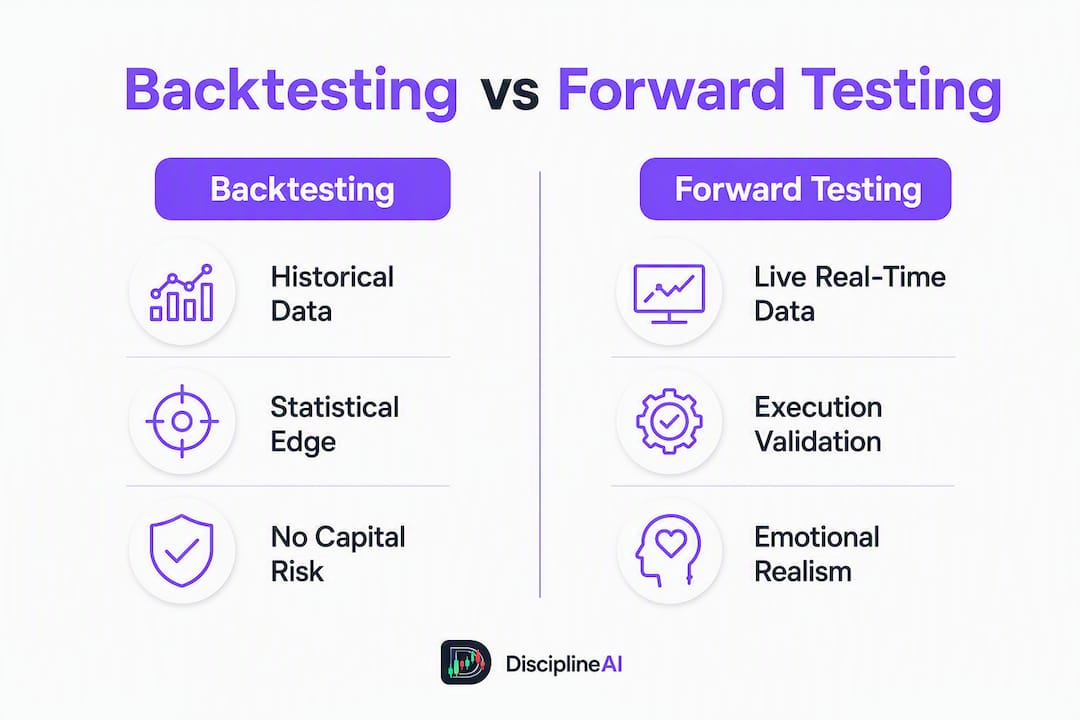
A large divergence between backtest and forward results almost always points to one of three causes: the backtest used unrealistic fill assumptions, the live data feed differs from the historical source, or trader behavior is deviating from the rules. Forward tests run on live data measure real spreads and slippage directly rather than relying on modeled assumptions, which is why the forward stage catches what the backtest cannot.
When should you use each method, and in what order?
The sequence is not optional. Running a forward test before a rigorous backtest wastes months on a strategy that basic statistical analysis would have eliminated in days. Running a backtest without a forward test sends you live with no evidence that execution and discipline hold up.
- Research and idea generation — define the rules precisely enough to code or manually backtest them; no discretionary elements
- Backtest with WFA — run IS optimization, validate on OOS, roll forward across multiple periods; target 200+ trades in OOS windows combined; typical duration 6–18 months of historical data
- Demo forward test — freeze parameters, run on live feed for 60–90 days minimum, journal every trade; professional pipelines typically run 3–6 months of paper trading on a live stream before allocating real capital
- Micro live — real capital at 10–20% of target size for 30+ trades; confirm that live P&L tracks demo P&L within a reasonable band
- Full sizing — only after micro live passes both statistical and behavioral criteria
Pro Tip: At each transition, write down your pass/fail criteria before you start the next stage. Traders who define thresholds after seeing results almost always move the goalposts. Commit to the number first.
Decision checkpoints:
- Backtest → forward: OOS expectancy positive across at least two WFA windows, profit factor above 1.3, max drawdown within acceptable risk tolerance
- Forward → micro live: live expectancy within 60–70% of backtest, rule-follow rate above 90%, no single behavioral override that exceeded 1R loss
- Micro live → full size: live P&L tracks demo P&L within 15%, no execution anomalies, consistent journaling throughout
Common pitfalls and how to avoid them
Overfitting
The clearest sign of an overfit strategy is OOS performance that is dramatically worse than IS performance. Defense: keep parameter counts low (fewer free variables = less room to fit noise), use WFA rather than a single IS/OOS split, and apply Monte Carlo analysis to stress-test the equity curve. If removing one parameter collapses performance, the strategy is not robust.
Look-ahead bias and data snooping
Timestamp audits catch most look-ahead bugs: verify that every signal fires only after the bar that generated it has closed. For indicator-based strategies, check whether the indicator repaints on historical data. The signal-count comparison described in the backtesting section (comparing backtest signals against forward-test signals for the same calendar days) is a practical diagnostic.
Slippage and liquidity
Stress-test your fill assumptions by modeling widened spreads during news windows and partial fills during low-liquidity periods. If your strategy trades around economic releases, the spread at entry can be three to five times the normal level. A backtest that assumes normal spreads throughout will overstate performance materially.
Emotional drift
This is the pitfall most traders underestimate. A strategy that looks clean in backtesting can unravel during a forward test simply because the trader starts skipping signals after three consecutive losses. Journaling rule-follow percentage and tracking discretionary overrides converts this from a vague concern into a measurable metric. Resources on emotional trading patterns can help you identify which behavioral tendencies to watch for.
Pro Tip: After each forward-test week, calculate your rule-follow rate: trades taken as signaled divided by total signals generated. A rate below 85% is a process problem, not a strategy problem. Fix the process before drawing any conclusions about the strategy.
Which metrics should you track in both tests?
Core strategy metrics
| Metric | Where measured | Action if out of range |
|---|---|---|
| Net P&L | Both | Investigate cause before advancing |
| Expectancy per trade | Both | Forward expectancy below 60–70% of backtest = investigate fills |
| Win rate | Both | Large divergence suggests execution or signal issues |
| Profit factor | Both | Below 1.3 in OOS = likely overfit |
| Max drawdown | Both | Exceeds backtest max = review position sizing |
| Sharpe ratio | Backtest primary | Below 0.5 in OOS = marginal edge |
Execution metrics
- Average slippage per trade (in ticks, pips, or basis points)
- Partial-fill rate and average fill percentage
- Spread at entry versus typical spread
- Rejected or requoted orders count
- Execution latency for automated strategies
Behavioral and process metrics
- Rule-follow percentage (trades taken as signaled / total signals)
- Number of discretionary overrides and their P&L impact
- Journaling completeness (percentage of trades with full log entries)
Consistent rule-following during forward testing is a more reliable readiness indicator than an absolute P&L threshold. Discipline breaches during the forward stage predict amplified losses when real capital is at stake, because the same behavioral tendencies scale with position size.
A practical forward-test checklist you can use today
Pre-test setup
- Confirm your live data feed matches the historical source used in the backtest
- Set commission and spread settings in your demo platform to match your live broker's rates
- Freeze all strategy parameters and code; document the version in writing
- Create a trade journal template with fields: date, signal time, entry price, expected fill, actual fill, slippage, exit price, P&L, rule followed (Y/N), emotional state, notes
Daily execution checklist
- Verify each signal against the strategy rules before acting
- Record actual fill versus expected fill immediately after execution
- Note spread at entry
- Log emotional state (calm / uncertain / anxious / overconfident) at the moment of the trade
- Take a screenshot of the chart at signal time
Minimum duration by trading frequency
- Scalping (10+ trades/day): 30 days minimum, 60 preferred
- Day trading (2–5 trades/day): 60 days minimum, 90 preferred
- Swing trading (3–10 trades/week): 90 days minimum, 120 preferred
- Position trading (1–4 trades/month): 6 months minimum
What to log for each trade
- Instrument, timeframe, direction
- Signal trigger (which rule fired)
- Entry time and price; expected vs actual fill
- Slippage in ticks or pips
- Exit time, price, and reason (target, stop, manual)
- Net P&L in R-multiples
- Rule followed: yes/no; if no, reason
Pro Tip: Review your journal weekly, not just at the end of the forward window. Weekly reviews catch behavioral drift early, when it is still correctable, rather than after it has contaminated the entire sample.
For a structured comparison of paper trading platforms that support this kind of journaling workflow, the best paper trading app alternatives guide covers the options worth considering.
Why behavioral measurement is the part most traders skip
The gap between backtest results and live results is rarely a strategy problem. Most strategy failures on going live stem from execution and behavioral breakdowns, not flawed logic. A trader who follows rules perfectly in a backtest (because there is no emotional pressure) and then skips two signals after a losing streak has introduced a variable the backtest never measured.
Paper trading often omits or underestimates exchange fees and liquidity-driven slippage that reduce net profitability versus simulation. But the behavioral gap is harder to quantify and therefore easier to ignore. The most reliable way to surface it is to track rule-follow percentage as a primary metric throughout the forward test, not as an afterthought.
Practical measurement methods:
- Rule-follow percentage: calculated weekly from journal entries; target above 90%
- Override log: every discretionary deviation gets its own entry: what rule was broken, why, and what the outcome was
- Skin-in-the-game proxy: a small real-money mirror account that makes the emotional cost of overrides tangible
Measuring when and why you override rules is the single most valuable data point a forward test can produce. It converts subjective behavior into a process change you can actually test.
A documented override pattern during forward testing often exposes a specific execution hole: for example, a trader who consistently skips re-entry signals after a stop-out is effectively running a different strategy than the one backtested. The corrective step is to write that behavioral tendency into the rules explicitly, either as a constraint or as a filter, and retest. AI-driven pre-execution checks can flag when a setup matches historical override conditions, giving you a real-time behavioral prompt before the decision is made.
Pro Tip: After each override, write one sentence: "If this situation recurs, the rule is ___." After ten overrides, look for the pattern. You will almost always find one or two recurring triggers. Those are your behavioral risk factors, and they belong in your trading rules.
Key Takeaways
Backtesting validates the strategy's statistical edge; forward testing validates whether that edge and your execution survive real market conditions. Run them sequentially, never as substitutes.
| Point | Details |
|---|---|
| Run them in order | Backtest with walk-forward first, then demo forward test, then micro live before full sizing. |
| Sample-size expectations differ | Backtests produce many trades quickly; forward tests require several weeks to months to gather enough trades for execution confidence. |
| Failure modes are different | Backtesting fails through overfitting; forward testing fails through execution breakdown and behavioral drift. |
| Discipline is a measurable metric | Track rule-follow percentage weekly; a rate below 85–90% is a process problem, not a strategy problem. |
| Disciplineaiapp | Provides paper trading with P&L tracking, automated trade journaling, behavioral pattern tracking, and execution-quality scoring to instrument the full backtest-to-live pipeline. |
The part nobody talks about honestly
Most trading education treats backtesting and forward testing as technical steps in a checklist. They are not. They are two completely different types of evidence about two completely different questions, and conflating them is how traders end up going live with a strategy that looks great on paper and falls apart within six weeks.
The conventional wisdom says "backtest first, then paper trade, then go live." That is correct as far as it goes. What it misses is that the forward test is not a confirmation exercise. Its job is to break the strategy, or more precisely, to break you while running the strategy. A forward test that produces results identical to the backtest is not evidence of a great strategy. It is evidence that you have not yet encountered the conditions that will stress your discipline.
The staged approach matters for a specific reason: each stage exposes a different failure mode. The backtest catches statistical problems. The demo forward test catches execution problems and mild behavioral ones. The micro live stage catches the behavioral problems that only surface when real money is at stake. Skipping micro live and going straight from demo to full size is where most traders lose capital they did not need to lose.
One more thing worth saying plainly: process stability during forward testing is a better readiness signal than P&L. A trader who follows rules consistently and loses money during a forward test has learned something useful. A trader who makes money while overriding rules half the time has learned nothing except that luck can cover for poor process, temporarily.
Disciplineaiapp makes the forward-test workflow measurable
Running a rigorous forward test requires more than a demo account. You need paper trading with accurate P&L tracking, a journaling system that captures execution quality and behavioral data, and a way to compare live performance against your backtest baseline.

Disciplineaiapp covers the full validation pipeline in one place. The platform's paper trading tracks P&L against your backtest targets in real time. Automated trade journaling logs fills, slippage, and execution quality without manual data entry. Behavioral pattern tracking flags override tendencies and discipline deviations as they happen, not after the fact. The market replay feature with fog-of-war simulation lets you practice execution under realistic conditions before committing to a live forward window. Execution-quality scoring gives you a concrete number to compare across stages, so the transition from demo to micro live is based on evidence rather than gut feel.
If you are ready to instrument your validation pipeline, explore Disciplineaiapp's features or go straight to the main app page to start a trial.
Useful sources and further reading
- Backtesting and Forward Testing: Methodology and Pitfalls — detailed methodology guide covering OOS splits, walk-forward procedures, and common implementation errors; the source for several timeline and signal-count diagnostics cited in this article
- Forward Testing of Trading Strategies — FTMO Academy's guidance on journaling discipline, including screenshot logging and emotional-state recording
- Backtest vs Forward Test: What Actually Predicts Live EA Performance? — MQL5 community analysis of sample-size asymmetry between backtests and forward tests; useful for automated strategy developers
- Paper Trading vs Real Trading — covers the cost and slippage gaps between simulation and live trading, including typical fee ranges by asset class
- Paper Trading vs Live Trading — AlgoTest's breakdown of what paper trading validates (strategy logic, workflow familiarity) versus what it cannot replicate
- Backtesting Prediction Market Strategies with 200M+ Price Snapshots — covers high-fidelity historical data infrastructure for traders who need large-scale, survivorship-free datasets for backtesting