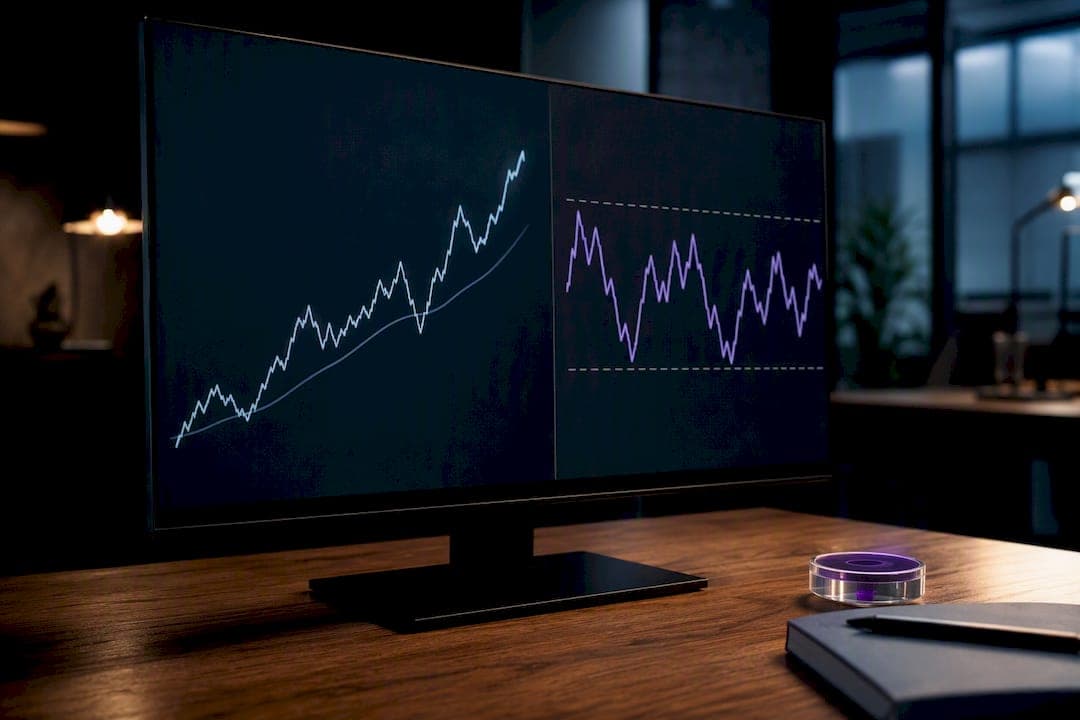
Label the market now with one test: measure the 50-period moving average slope, then divide ATR by the recent high-low range. A steep slope with a high ATR/range ratio means trend; a flat slope with a compressed ratio means range; anything in between is a transition, and transitions call for smaller size or standing aside entirely. Once you have the label, switch to the matching rule set, not the other way around.
TL;DR:
- Combining the 50-period moving average slope, ATR-to-range ratio, and ADX provides a reliable way to classify market regimes in under a minute.
- A strong trend shows a slope above 0.15-0.3%, ATR/range above 0.6, and ADX over 25, while a range signals flat slope, ATR/range below 0.4, and ADX under 20.
- False signals occur during false breakouts, so requiring ATR expansion and higher timeframe confirmation filters out most traps.
- Detectors should be calibrated for each asset and tested across multiple assets and periods to avoid overfitting or premature trust in their signals.
- Automated AI tools help maintain continuous scanning and confidence scoring, reducing manual effort and improving regime detection accuracy.
Table of Contents
- What Counts as Trend vs Range Detection?
- Quick Checklist: Three Detectors to Run Right Now
- Practical Indicators and How to Stack Them
- How to Turn a Label Into a Rule Set
- Where Regime Labels Go Wrong
- How AI Supports Market-Regime Detection
- My Daily Regime Check
- Put Regime Detection on Autopilot With Discipline AI
- Sources
What Counts as Trend vs Range Detection?
Trend vs range detection is the practice of classifying the current market state so you apply the correct strategy logic. It matters because a trend-following entry executed inside a range gets chopped up by mean reversion, and a range-fade entry taken inside a real trend gets run over. Traders sometimes call this market regime classification, and quant desks use the same term when building systematic filters.
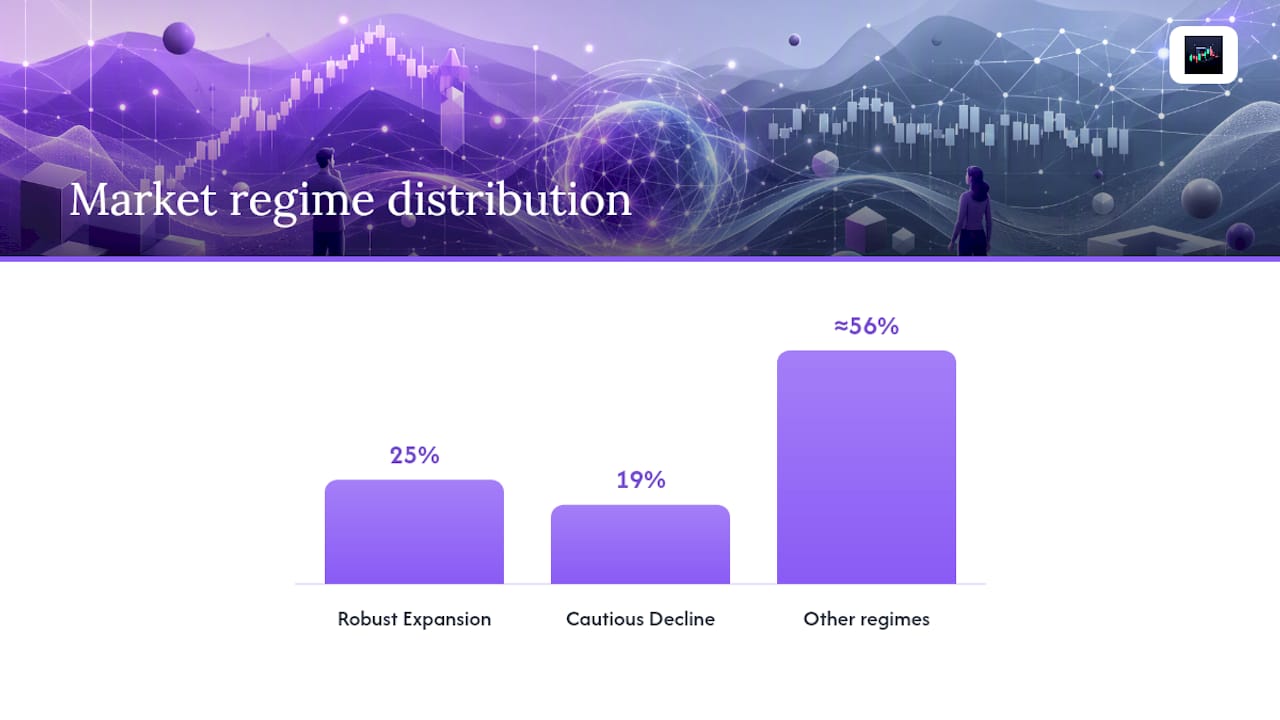
A 1995–2024 analysis of market regimes found markets spend roughly 25% of observed periods in a "Robust Expansion" state and about 19% in "Cautious Decline." That leaves more than half the time in other regimes, including choppy, directionless conditions. Markets are not always trending, and they are not always ranging. They cycle, and your detector has to catch the cycle, not just the extremes.
The practical difference shows up in money management. Trend traders join a directional move and use tight, trailing stops with continuation logic. Range traders fade edges and use mean-reversion sizing built around a defined ceiling and floor. Apply one mindset in the other's territory and you're fighting the market's actual structure.
Quick Checklist: Three Detectors to Run Right Now
You don't need a research desk to label a chart. Three detectors, checked together, give you a working answer in under a minute.
- MA-slope detector. Plot a 50-period and a 100-period moving average. Calculate the absolute slope of the 50-period line over the last 10 to 20 bars. A slope holding steadily above roughly 0.15% to 0.3% per bar (scaled to the asset's typical daily move) signals directional persistence. Near-zero slope, with price crisscrossing the line, signals range.
- ATR-to-range ratio. Divide ATR(14) by the high-low range of the same lookback window. A ratio above about 0.6 to 0.7 usually points to expansion and trend behavior. A ratio below 0.4 usually points to compression and range behavior.
- ADX-based detector. ADX above 25 generally confirms directional strength; below 20 usually confirms a range. Pair it with the volatility filter above, because ADX alone can lag sharp reversals.
None of these three works well in isolation. Stacked together, they cut down the false labels that come from trusting a single line on the chart.
Practical Indicators and How to Stack Them
Each indicator answers a different question. Moving average slope answers "which way is price moving on average?" ATR/range answers "how much room is price actually using?" ADX answers "how strong is that direction, statistically?" Combine all three and you get a signal stack instead of a single opinion, which matches how regime classification frameworks are built at a professional level: multiple channels, none given sole authority.
Here's a workable recipe for combining them:
- Direction layer. Check 50MA slope against 200MA trend direction. If both point the same way, you have directional agreement. If they diverge, treat the market as unresolved and lean toward "transition."
- Volatility layer. Compute ATR(14)/range(14). Thresholds shift by asset. Major FX pairs often sit lower (0.5 to 0.6 for trend) than crypto, which tends to run hotter across the board. Treat these as starting points, not fixed rules, and recalibrate per instrument.
- Strength layer. Add ADX(14) and watch Bollinger Band width. Bands expanding alongside rising ADX confirms trend. Bands pinching tight with ADX under 20 confirms range. 1kPips' framework makes the same point: volatility is the dimension most traders skip when they only look at direction.
Putting it together: a "strong trend" reads as MA slope above your chosen threshold, ATR/range above roughly 0.6, and ADX above 25. A "clear range" reads as flat MA slope, ATR/range below roughly 0.4, and ADX below 20. Everything between those bands is a transition zone, not a coin flip.
Pro Tip: Run your ATR/range calculation on the last three lookback windows, not just the most recent one. A ratio that's been climbing for three consecutive checks tells you more about direction of change than one static snapshot.
For a deeper dive on which momentum and breakout indicators pair best with this stack, the best trend indicators for smarter trading breaks down the options by asset class.
How to Turn a Label Into a Rule Set
A label without a rule attached is trivia. Here's how to convert each state into something you can actually trade.
- Trend rule set. Enter on a pullback into a defined decision zone (often the 50MA or a Fibonacci retracement band), require a confirmation candle or momentum uptick before filling, and place stops based on ATR multiples rather than fixed pip counts. Size targets to the trend's measured volatility, not a flat percentage.
- Range rule set. Enter near the range's edges, wait for a rejection wick or reversal confirmation at the touch, and keep targets tighter than trend trades. Position size should shrink relative to trend trades since the profit window is narrower.
- Multi-timeframe recipe. Zoom out one or two timeframes to establish the dominant regime, then execute entries on your working timeframe. Add hysteresis, meaning the regime label has to hold for a set number of bars before you act on a flip, or you'll get whipsawed by noise near the threshold. The three-timeframe checklist walks through this alignment step by step.
- Backtest and validation checklist. Run walk-forward testing across multiple market cycles, hold out a separate sample the model never saw during tuning, and set a retraining cadence, monthly or quarterly depending on asset volatility, so the detector doesn't drift stale. A SMA plus ATR regime filter is a well-documented starting template for coding this logic directly into a systematic strategy.
Stop placement and position sizing tied to volatility deserve their own deep dive, covered in the volatility breakout strategy guide.
Where Regime Labels Go Wrong
False breakouts are the most common failure. Price pokes above a range boundary, traders pile in expecting a new trend, and then price snaps back inside the range because volatility never actually expanded. Requiring an ATR expansion alongside the breakout, plus agreement from a higher timeframe, filters out a large share of these traps.
There's also a lag versus noise tradeoff baked into every detector. Shorter lookback periods react faster to real regime shifts but also flag more false signals during normal chop. Longer lookbacks smooth the noise but confirm changes later, sometimes well after the move has already started. There's no setting that eliminates both problems at once; you're choosing which risk you'd rather manage.
- Avoid tuning thresholds to one market or one sample period; a slope or ATR ratio that works beautifully on six months of one crypto pair often falls apart on a different asset.
- Test detector rules across multiple assets and multiple time periods before trusting them live.
- Treat any ambiguous reading as "transition" rather than forcing a trend or range label.
Machine-learning regime models using Hidden Markov Models identified regimes with less lag than clustering approaches in one S&P futures study, but out-of-sample performance degraded without retraining. Even a statistically sound model needs a refresh cycle, or its edge quietly decays.
How AI Supports Market-Regime Detection
Manual detectors work, but scanning fifteen charts across three timeframes every morning is where discipline erodes. This is where an AI layer earns its place, not by replacing the rules above but by running them continuously and flagging when several channels line up at once. Discipline AI applies multi-channel stacking across market structure, volatility, and liquidity signals, then attaches a confidence score to each read rather than a flat yes-or-no label.

AI-assisted scanning helps most in noisy conditions, across multiple assets simultaneously, and in automated backtesting where retraining cadence matters more than any single lucky parameter. The tool's trade autopsy feature reviews closed trades against the regime label that was active at entry, which surfaces mislabeled setups you'd otherwise miss. None of this replaces validation. Every AI-generated signal should still get checked against holdout data before it touches live capital, the same discipline that applies to any statistical model.
My Daily Regime Check
Every morning, before anything else, I zoom out one or two timeframes and mark the last volatility expansion or compression on the chart. That single glance tells me more about the current regime than any single indicator reading. I write the label down: trend, range, or transition, along with the reasoning that got me there.
If the label comes out "transition," I cut position size or skip the session entirely. It's a hard habit, since transitions often look like the start of something exciting, but that's exactly when the wrong rule set costs the most. A short log entry each day, three lines, is enough to catch when my own labeling drifts and needs recalibrating.
— Tony
Put Regime Detection on Autopilot With Discipline AI
Running the MA-slope, ATR/range, and ADX checks by hand across multiple assets every session is the part most traders quietly abandon after a few weeks. Discipline AI keeps that scan running continuously, stacking volatility, structure, and liquidity signals into a single confidence score so you're not eyeballing three indicators on fifteen charts before your coffee gets cold.

There is a trade autopsy feature that replays closed trades against the regime label that was active at entry, helping you to evaluate your trading decisions. Start with the AI Learning Center to work through hands-on examples of regime labeling and confidence scoring before you connect the tool to live capital. Get comfortable with how the confidence scores behave across a few paper trades first, then decide where automated detection fits into your own routine.
Sources
- Decoding market regimes — machine-learning insights (SSGA)
- Forex: Should You Be Trading Trend or Range? (Investopedia)
- Market regime detection (LSEG developers article)