
Trend alignment trading means entering with the medium-term trend while the short-term chart is still pulling back against it, buying into weakness that's already losing steam. Check three timeframes before every entry: a higher one for direction, a middle one for setup, and a lower one for timing, and apply one filter: only take the trade if the higher and middle timeframes agree.
A quick check on your charts looks like this:
- Higher timeframe: is price making higher highs or lower lows?
- Middle timeframe: has it pulled back to a logical support or resistance zone?
- Lower timeframe: is momentum turning back in the higher timeframe's direction?
Key Takeaways
Trend alignment trading works because entering with the medium-term trend during a short-term pullback consistently produces stronger win rates than trading against misaligned timeframes.
| Point | Details |
|---|---|
| Use three timeframes | Space them by a factor of 4 to 6 (weekly/daily/4-hour or similar) to avoid analyzing the same noise twice. |
| Confirm with different indicator categories | Pair a trend filter, a momentum reading, and a volume or volatility check rather than duplicating one signal type. |
| Size down on partial alignment | If only two of three timeframes agree, cut position size and tighten the stop instead of skipping or forcing full size. |
| Skip outright conflicts | When the higher and middle timeframes disagree, don't take the trade, no matter how good the entry candle looks. |
| Automate the scan, not the trigger | Tools like Discipline AI can score alignment across assets and timeframes, leaving the final entry decision to you. |
Table of Contents
- Why Trend Alignment Works and When to Skip It
- How to Choose and Separate Your Three Timeframes
- Which Indicators Confirm a Trend Alignment Setup
- Your Pre-Trade Trend Alignment Checklist
- A Worked Example: Alignment in Action
- Risk Controls and Mistakes That Ruin Good Setups
- Using Tools and AI to Run Alignment Checks
- Put Trend Alignment on Autopilot With Discipline AI
- Sources
Why Trend Alignment Works and When to Skip It
Markets move in nested waves. A weekly uptrend contains daily corrections, and those daily corrections contain hourly bounces that look like reversals but usually aren't. Trading with the top-down hierarchy, macro trend first, meso structure second, micro entry last, means you're never fighting the bigger current just because a smaller one looks convincing.
The numbers back this up. Perfect alignment across three timeframes produces win rates around 60–70%, while trades taken against misaligned timeframes often fall below 30%. That's not a marginal edge. That's the difference between a strategy that survives drawdowns and one that doesn't.
Alignment shines on:
- Swing entries into an established trend
- Pullback entries after a shakeout
- Filtering out false breakouts that fail on the higher timeframe
It struggles in choppy, range-bound markets where there's no dominant trend to align with in the first place. Forcing alignment logic onto a sideways market just produces false signals dressed up as confirmation.
How to Choose and Separate Your Three Timeframes
The mistake most traders make isn't picking bad timeframes, it's picking timeframes too close together. If your "higher" and "middle" charts are both showing you the same three candles of noise, you're not confirming anything, you're just looking at the same picture twice.
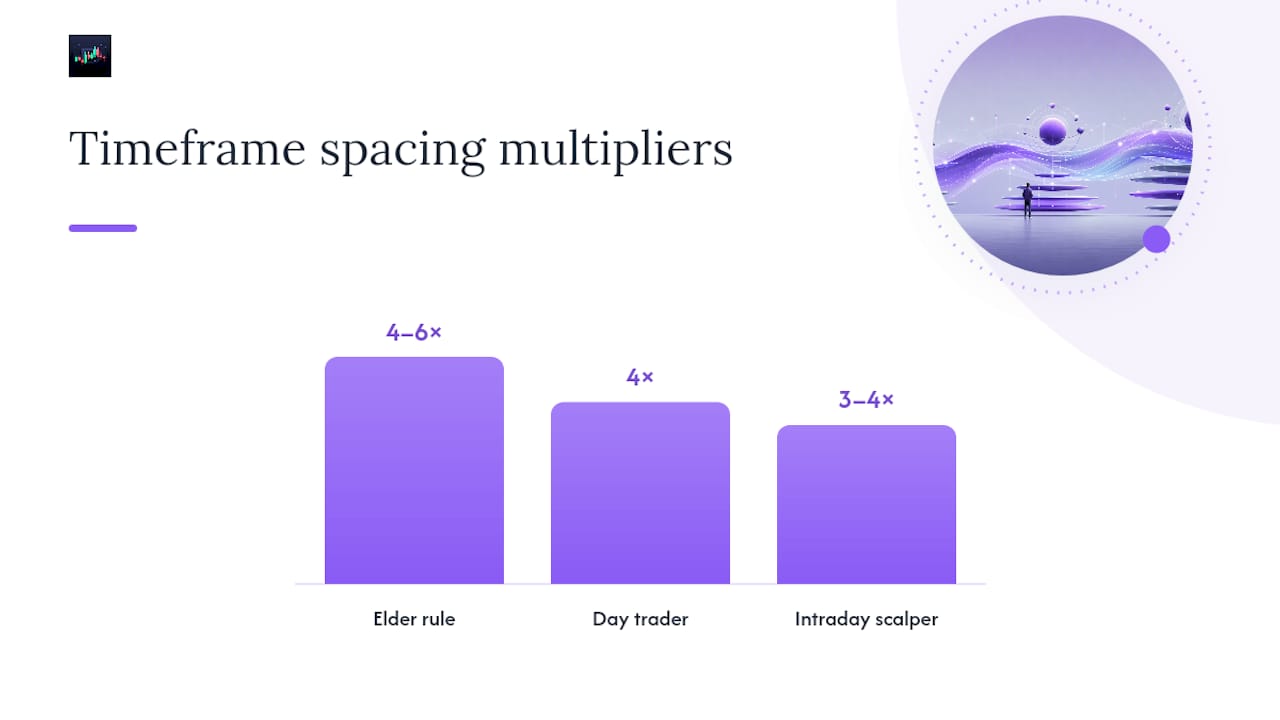
That's where the factor-of-4-to-6 rule comes in. Each timeframe should be roughly four to six times longer than the one below it, a spacing popularized by Alexander Elder's Triple Screen system and still one of the more useful shortcuts in multi-timeframe analysis. Three ready-made sets:
- Swing trader: Weekly (bias), Daily (setup), 4-hour (entry)
- Day trader: 4-hour (bias), 1-hour (setup), 15-minute (entry)
- Intraday scalper: 1-hour (bias), 15-minute (setup), 5-minute (entry)
Pro Tip: Crypto trades 24/7 and moves faster than equities, so many crypto traders compress the ratio slightly, using something closer to a factor of 3 to 4 on the lower end. Forex majors during liquid sessions hold up fine at the standard 4 to 6 spacing.
Which Indicators Confirm a Trend Alignment Setup
Stacking three moving averages doesn't give you three confirmations, it gives you one signal repeated three times. Real confirmation comes from pairing indicators that measure different things entirely.
Think in four categories:
- Trend: moving average crossovers (a 50/200 cross, or price relative to a 20 EMA) mark direction and act as dynamic support or resistance
- Momentum: MACD shows whether that trend is accelerating or fading, and RSI flags overbought or oversold pullback zones with divergence
- Volatility: ATR or Bollinger Bands tell you whether a pullback is a normal retracement or a structural break
- Volume: On-Balance Volume confirms whether real participation is backing the move
Investopedia describes solid confirmation as using additional, ideally independent, indicators rather than several versions of the same signal, and it's a fair warning against confirmation bias, seeing what you want to see because three trend-following tools all agree with each other by design. Moving averages, MACD, RSI, and OBV each measure something distinct, which is exactly why they work well together.
A workable confirmation rule: trend confirmed on the higher timeframe, momentum pulling back (not reversing) on the middle timeframe, and volume or momentum turning back up on the lower timeframe. Three categories, three timeframes, one green light.
Your Pre-Trade Trend Alignment Checklist
Run this before you click buy or sell:
- Identify the higher-timeframe trend direction using price structure and a moving average.
- Confirm the middle timeframe has pulled back to support, resistance, or a moving average without breaking structure.
- Check momentum (RSI or MACD) on the middle timeframe to confirm the pullback is losing steam, not reversing.
- Drop to the lower timeframe and wait for a reversal candle, break of a micro trendline, or volume pickup as the entry trigger.
- Set your stop below the recent swing low (long) or above the swing high (short), or use 1.5 to 2x ATR from entry.
- Size the position so the stop distance equals no more than 1% of account equity in dollar risk.
- If only two of three timeframes agree, treat it as partial alignment: cut position size in half and tighten the stop.
- If the higher and middle timeframes conflict outright, skip the trade. No exceptions.
A Worked Example: Alignment in Action
Say you're swing trading and pull up the weekly, daily, and 4-hour charts on a large-cap stock. The weekly shows a clean uptrend, higher highs since the last earnings gap. That's your bias.

On the daily, price pulls back to the rising 20-day moving average after a three-week run, RSI drops from 68 to 44. That's a normal retracement, not a breakdown. On the 4-hour chart, you watch for a bullish engulfing candle right at that moving average, paired with OBV ticking upward as buyers step back in. That candle is your trigger.
Entry goes in on the close of that candle. Stop sits just below the 4-hour swing low, roughly 1.5 ATR away. Initial size risks 1% of the account. As price moves in your favor, trail the stop below each new higher low on the 4-hour chart and take partial profits at the prior swing high.
Pro Tip: Screenshot every aligned setup before you enter. Reviewing a folder of 20 trades later shows you patterns your memory won't.
Risk Controls and Mistakes That Ruin Good Setups
Alignment improves your odds, it doesn't eliminate risk. Stop discipline still decides whether you're around for the next setup. Use structure-based stops (beyond the recent swing point) or a fixed ATR multiple, and never widen a stop after entry because the trade "just needs room."
The behavioral traps show up more than the technical ones:
- Waiting for all three timeframes to line up perfectly and missing every early entry as a result
- Overleveraging a two-out-of-three partial alignment because it "felt" strong
- Confirmation bias: adding indicators until one finally agrees with the trade you already wanted to take
- Applying trend alignment logic in a range, where trend-following approaches consistently underperform
Asset class matters too. Forex majors respect technical levels cleanly during major sessions. Stocks add earnings and news risk that can override any alignment. Crypto adds thinner liquidity and sharper wicks, so wider stops or smaller size often make sense even with clean alignment.
Using Tools and AI to Run Alignment Checks
Doing this manually works, but it's slow, and slow is where discretionary traders start skipping steps under pressure. A multi-chart workspace with your three timeframes pinned side by side is the minimum setup. Beyond that, alerts for timeframe flips (a moving average cross on the higher timeframe, for instance) save you from staring at charts all day waiting for alignment to happen.
Some traders build a simple scoring script: score each timeframe +1, 0, or -1 for trend direction, and only act when the sum hits +3 or -3. It's a blunt filter, but it's fast and easy to backtest against historical data.
Pro Tip: Automate the scanning and scoring. Keep the final entry decision manual, since news events and structural context that a script won't catch can override even a perfectly aligned setup.
AI-generated confidence scores extend this idea by weighing more variables at once, structure, volatility, liquidity, historical outcomes, than a person can track live across multiple assets.
A Practitioner's Take on Trend Alignment
Alignment is a filter, not a crystal ball. It raises your odds; it doesn't remove the need for a stop loss or a clear head when a trade goes against you. Skip trades that don't line up. Discipline beats conviction every time.
Put Trend Alignment on Autopilot With Discipline AI
Running the checklist above by hand across multiple assets gets tedious fast, and tedium is exactly when traders start skipping the third timeframe check. Discipline AI scans multiple assets across multiple timeframes at once and scores alignment directly, so you see which setups actually meet the three-timeframe bar before you spend time on the chart.

Three features map straight onto the checklist you just read: multi-timeframe scans that flag when higher and middle timeframes agree, AI-generated confidence scores that quantify how strong that alignment is, and automated trade journaling that logs whether your aligned entries actually outperformed your misaligned ones over time. If you want to test the checklist at scale instead of one chart at a time, the Discipline AI Learning Center walks through sample scans and alignment templates you can try this week.
Sources
- Aligning Trend Across Timeframes | Pomegra Learn Library
- Multiple Timeframe Analysis: How to Align Entries Across Charts for Better Trades | TradeAlgo
- Confirmation Definition - Investopedia
This article is general information, not a substitute for advice from a qualified financial advisor. Consult a qualified financial professional about your own circumstances before acting on anything here.