
Profit factor is your single-number profitability gauge: gross profit divided by gross loss (using the absolute value of losses), where any result above 1.0 means the strategy is net profitable. Below 1.0, you're losing money. That's the whole definition.
Here's what the number tells you at a glance:
- Below 1.0: Losing strategy. Stop trading it.
- 1.0–1.25: Marginal. Likely indistinguishable from random within the sample.
- 1.25–1.5: Decent edge. Viable in real-world conditions.
- 1.5–2.0: Strong. Most consistently profitable retail traders run net profit factors of 1.3–1.8.
- 2.0–3.0: Excellent. Verify sample size and that fees are included.
- 3.0+: Exceptional or curve-fitted. Either you found a real edge or your backtest is lying. What it hides: drawdown severity, sample-size fragility, and whether a single outlier trade is doing all the heavy lifting. Use it as a diagnostic, not a report card.
Table of Contents
- How do you calculate profit factor in trading?
- A worked example you can replicate in a spreadsheet
- What counts as a good profit factor?
- How profit factor connects to win rate and risk-to-reward
- When does profit factor mislead you?
- How to segment profit factor to find your real edge
- How to use profit factor analysis to improve your strategy
- Practical tools and workflows for tracking profit factor
- Key Takeaways
- The metric that traders misuse most
- Disciplineaiapp tracks your profit factor so you can act on it
- Useful sources
How do you calculate profit factor in trading?
The formula is short: Profit Factor = Sum of Winning Trades ÷ |Sum of Losing Trades|
The absolute value on the denominator matters because losing trades are negative dollar amounts. You want two positive totals producing a clean ratio.
Step-by-step:
- Export all closed trades for the period or strategy you're evaluating. Open positions don't count.
- Net out fees per trade. Subtract commissions, exchange fees, and realistic slippage from each trade's P&L before sorting winners from losers. A gross profit factor inflates the number and creates false confidence.
- Sum all winning trades (net P&L > $0). This is your gross profit.
- Sum the absolute value of all losing trades (net P&L < $0). This is your gross loss.
- Divide gross profit by gross loss. The result is your net profit factor.
What to include and what to watch:
- Closed trades only, including partial fills (count the closed portion).
- Round-trip commissions, exchange fees, and slippage on every trade.
- Rebates, if applicable, reduce your effective cost and should be credited.
- Calculate PF at the strategy or setup level, not just the aggregate account level. Blending unrelated setups into one number can hide a losing system behind a winning one.
Pro Tip: Calculate PF separately for each tagged setup. An account-level PF of 1.5 can mask a setup running at 0.8 that's quietly bleeding your edge.
A worked example you can replicate in a spreadsheet
Here's a compact 10-trade dataset. Fees are $8 round-trip per trade.

| Trade | Gross P&L | Fees | Net P&L | W/L |
|---|---|---|---|---|
| 1 | +$420 | $8 | +$412 | W |
| 2 | –$180 | $8 | –$188 | L |
| 3 | +$310 | $8 | +$302 | W |
| 4 | –$95 | $8 | –$103 | L |
| 5 | +$850 | $8 | +$842 | W |
| 6 | –$220 | $8 | –$228 | L |
| 5 | +$190 | $8 | +$182 | W |
| 8 | –$140 | $8 | –$148 | L |
| 5 | +$280 | $8 | +$272 | W |
| 10 | –$160 | $8 | –$168 | L |
Calculation:
- Sum of winning net P&L: $412 + $302 + $842 + $182 + $272 = $2,010
- Sum of losing net P&L (absolute): $188 + $103 + $228 + $148 + $168 = $835
- Profit Factor = $2,010 ÷ $835 = 2.—
Now remove Trade 5 (the $842 winner, the clear outlier):
- Winning sum: $412 + $302 + $182 + $272 = $1,168
- Losing sum: $835 (unchanged)
- Profit Factor = $1,168 ÷ $835 = 1.40
One trade dropped the PF from 2.— to 1.40. That's the fragility of small samples in plain arithmetic. A single outlier trade in a 30-trade sample can push profit factor from 1.0 to 1.8 — remove it and the strategy looks marginal.
Spreadsheet setup: Column A = trade number, B = gross P&L, C = fees, D = net P&L (=B–C), E = "W" or "L" tag. Gross profit: =SUMIF(E:E,"W",D:D). Gross loss: =ABS(SUMIF(E:E,"L",D:D)). Profit factor: =gross_profit/gross_loss. Add a setup tag column and use SUMIFS to compute PF per setup.
What counts as a good profit factor?
Context determines the answer. A PF of 1.3 in a high-frequency scalping strategy with 500 trades is meaningful evidence. The same number from 18 swing trades is noise.
Benchmark ranges by reliability:
- 1.0–1.25: Marginal. Fee drag alone can push this below breakeven. Requires a large sample before trusting it.
- 1.25–1.5: Decent. A real-world viable edge for many active traders.
- 1.5–2.0: Strong. Most consistently profitable retail traders run net profit factors of 1.3–1.8.
- 2.0–3.0: Excellent. Verify sample size and that all costs are included.
- 3.0+: Treat as a red flag in backtests. A PF above 3.0 on live conditions is rare; in backtests it usually indicates overfitting.
Scalpers running dozens of trades per day need a lower gross PF to survive because fees consume a larger share of each winner. A futures scalper targeting 2 ticks with a 2-tick stop at 65% win rate might show a gross PF of 1.86, but after $17–19 in round-trip friction per trade, the net PF collapses. Swing traders with fewer, larger trades can tolerate a higher gross PF because fee drag is proportionally smaller.
Quick threshold answers:
- Is 1.3 good? Decent, but vulnerable. Needs 200+ trades and net-of-fees calculation to trust.
- Is 1.5 good? Yes, for most active strategies with adequate sample size.
- Is 1.8 good? Strong. Consistent with the upper range of reliable retail performance.
- Is 3.0 good? In live trading with 300+ trades, possibly. In a backtest, investigate before celebrating.
Always compute net-of-fees PF. Gross PF is a vanity metric.
How profit factor connects to win rate and risk-to-reward
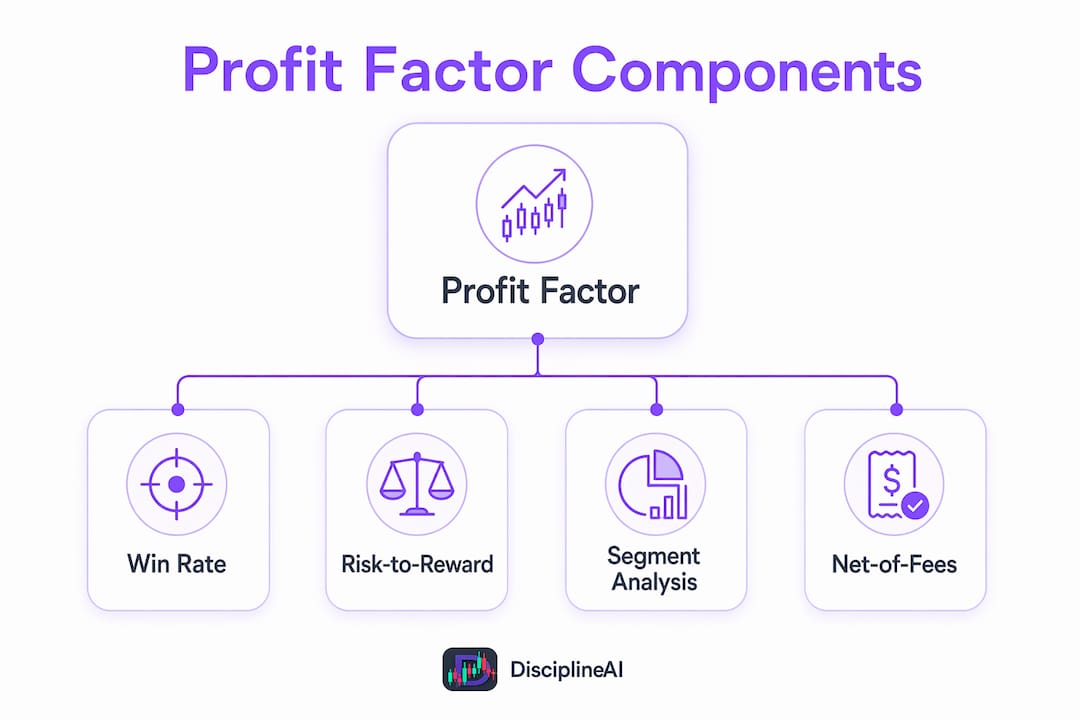
These three metrics are algebraically the same thing expressed differently:
PF = (Win Rate × R) ÷ (1 − Win Rate)
Where R is the payoff ratio (average winner ÷ average loser). Rearranged, the breakeven win rate for any R is: Win Rate = 1 ÷ (1 + R).
Numeric examples:
- Win rate 40%, R = 3.0: PF = (0.40 × 3.0) ÷ 0.60 = 2.0. A trader winning less than half their trades is running an excellent system.
- Win rate 70%, R = 0.5: PF = (0.70 × 0.5) ÷ 0.30 = 1.17. A high win rate with small winners and large losers barely clears breakeven.
- Win rate 67%, R = 1.0: PF = (0.67 × 1.0) ÷ 0.33 = 2.03. Two dollars gained for every dollar lost — the kind of profile that survives real-world friction.
Why this matters:
- Win rate alone is insufficient as a diagnostic because it ignores trade size. A 90% win rate can produce a PF below 1.0 if the rare losers are enormous, which is exactly what happens when traders sell options and let one bad week erase months of small credits.
- Profit factor captures both dimensions simultaneously, which is why it beats win rate as a compact health check.
- Expectancy (average expected P&L per trade) answers a different question: what you expect to make per trade given current sizing. A PF of 1.5 with $50 expectancy and 200 trades per year produces $10,000 annually. The same PF with $5 expectancy produces $1,000. Same quality, very different account progression. Use both.
What each metric reveals and hides:
- PF: Efficiency of the strategy. Hides drawdown path and trade frequency.
- Win rate: Frequency of success. Hides trade size asymmetry entirely.
- Expectancy: Dollar output per trade. Hides strategy quality when sizing changes.
- Sharpe ratio: Risk-adjusted return relative to volatility. Hides the cost structure and works best for strategies with normally distributed returns.
When does profit factor mislead you?
Several failure modes can make PF look better or worse than the strategy actually is.
Common traps:
- Small sample sizes. Under 30 trades, PF is noise; 50–100 trades is suggestive; 200+ gives reasonable confidence; 500+ is robust if not overfitted. One or two outlier trades dominate the ratio at small counts.
- Ignored fees and slippage. On high-frequency strategies, fees can be the difference between a PF of 1.3 and 0.5. Always include round-trip commissions, exchange fees, and realistic slippage.
- Look-ahead bias. Backtests that use future data to trigger entries inflate PF artificially. Verify that every signal uses only information available at the time of entry.
- Survivorship bias. Evaluating only strategies that survived a selection process overstates expected PF. Include all strategies tested, not just the ones that looked good.
- Regime shifts. A strategy optimized for trending markets will show a high PF in trending conditions and collapse in ranging ones. Backtested profit factors typically degrade 15–30% in live trading after costs, slippage, and execution differences.
- Overfitting. A PF above 3.0 on a small backtest sample is usually a red flag for curve-fitting rather than proof of a real edge. If PF looks great in aggregate but collapses across half the walk-forward windows, you have a curve fit, not an edge.
Statistical mitigations:
- Set a minimum trade count before acting on any PF reading (50 trades minimum; 200 preferred).
- Run out-of-sample testing: optimize on the first ~70% of your data, validate on the last ~30%.
- Report PF with and without your top 3 and bottom 3 outlier trades to see how dependent the metric is on extreme results.
- Track PF on a rolling 50–100 trade window. A stable strategy shows PF oscillating in a narrow band; a deteriorating one trends downward.
Pro Tip: If your backtest PF is above 2.5 and your parameter set has more than 3–4 free variables, run a walk-forward test before trading a single dollar. Curve-fitting is almost always the explanation.
How to segment profit factor to find your real edge
Aggregate PF hides as much as it reveals. The most useful version of this metric is segmented.

A morning session showing a PF of 2.1 and an afternoon session at 0.5 is a concrete decision: stop trading after lunch. That kind of insight is invisible in an account-level number.
Recommended segmentation dimensions:
- Strategy or setup tag (trend continuation, breakout, mean reversion)
- Time of day and session (pre-market, morning, midday, afternoon close)
- Day of week
- Holding time (scalp, intraday, overnight, multi-day)
- Ticker or sector
- Volatility regime (low VIX vs. high VIX, trending vs. ranging)
Workflow:
- Tag every trade at entry with setup type, session, and ticker.
- Export to a spreadsheet or analytics tool and compute PF per segment using
SUMIFS. - Check sample size per segment before drawing conclusions. A segment with fewer than 30 trades needs more data before acting.
- Compare variance across segments. A segment with high PF but only 15 trades is interesting, not actionable.
- Apply decision rules based on the results.
Example segment table:
| Setup | Trades | PF | Decision |
|---|---|---|---|
| Trend continuation | — | 2.1 | Scale up — validated edge |
| Breakout fade | — | 1.5–2.0 | Keep — monitor for regime sensitivity |
| Counter-trend | — | 0.5 | Drop — losing setup |
| Gap fill | — | 1.25–1.5 | Investigate — insufficient sample |
| News reaction | 18 | 0.5 | Pause — too few trades, negative PF |
The segmented analysis often reveals that a trader's real edge concentrates in 2–3 specific setups while the others bleed P&L. Cutting the losers doesn't just improve PF; it frees mental bandwidth for the setups that actually work.
Minimum sample per segment before acting: 30 trades to consider a change, 50 trades to implement one, 100 trades to be confident.
How to use profit factor analysis to improve your strategy
A PF reading without a follow-up action is just a number. Here's the operational playbook.
Decision rules by PF level:
- PF below 1.0 for a setup with 50+ trades: Stop the setup immediately. The evidence is clear.
- PF between 1.0 and 1.25 with 50+ trades: Reduce position size by 50% and investigate execution. Check whether planned R-to-R matches realized PF.
- PF between 1.25 and 1.5: Keep trading but look for the specific execution failures dragging it down.
- PF above 1.5 with 100+ trades: Maintain or scale. Don't tinker with what's working.
- PF above 3.0 in backtest: Validate out-of-sample before increasing size.
Execution interventions that raise PF:
- Tighten stops using market structure, not arbitrary percentages. A 20% reduction in average loss size with everything else constant lifts PF meaningfully.
- Let winners run. Extending targets by 1–2R or switching to trailing stops often improves average winner size. The trade-off is a slightly lower win rate, but the PF math usually wins.
- Enforce the initial risk. Moving stops wider after entry is one of the fastest ways to destroy PF. The planned risk-to-reward rarely matches realized PF when stops get moved.
- Reduce fee drag. On high-frequency styles, check round-trip cost as a percentage of your average loser. If fees are 6% of every loss, that's a direct PF tax.
Behavioral and journaling tactics:
- Log planned R alongside realized P&L for every trade. The gap between the two is your execution score.
- Tag rule breaks (early exit, widened stop, skipped entry) and compute PF separately for clean trades vs. rule-break trades. The difference is usually sobering.
- Review performance patterns that consistently degrade PF, such as closing winners early in the first hour or holding losers through key levels.
Pro Tip: If your realized PF is consistently below your planned R-to-R, the problem is almost never the strategy. It's execution. Instrument your journal to flag every trade where you deviated from the plan and compute PF on those trades alone.
Practical tools and workflows for tracking profit factor
You don't need expensive software to track PF well. A disciplined spreadsheet beats a fancy platform used inconsistently.
Spreadsheet minimum viable setup:
- Columns: Date, Ticker, Setup Tag, Session, Gross P&L, Fees, Net P&L, W/L, Planned R, Notes.
- Gross profit formula:
=SUMIF(W/L column,"W",Net P&L column) - Gross loss formula:
=ABS(SUMIF(W/L column,"L",Net P&L column)) - PF formula:
=gross_profit_cell/gross_loss_cell - Segmented PF:
=SUMIFS(Net P&L, W/L,"W", Setup Tag,"Trend")÷ABS(SUMIFS(...))
What to log on every trade:
- Entry and exit price, including partial fills
- Round-trip commission and exchange fees
- Estimated slippage (actual fill vs. intended price)
- Setup tag and session
- Planned R-multiple and realized R-multiple
- Any rule deviation (yes/no and brief note)
Automation tips:
- Export trades from your broker in CSV format weekly.
- Use a VLOOKUP or Power Query to auto-tag setup type from a reference table.
- Build a pivot table that computes PF per setup tag automatically on refresh.
- Schedule a 15-minute weekly review: update the export, check rolling PF by setup, flag any segment below 1.25.
When to graduate to an analytics platform: When you're running more than 3 active setups, trading more than 20 times per week, or when manual tagging is taking longer than the analysis itself. Before switching, validate that the platform computes net-of-fees PF and allows custom segmentation by tag. AI-driven pattern detection can automate the tagging step that consumes most of the manual workflow time.
Key Takeaways
Profit factor is the most useful single-number diagnostic for trading strategy quality, but only when calculated net of fees, segmented by setup, and validated across at least 200 trades.
| Point | Details |
|---|---|
| Calculate net PF only | Always subtract commissions, fees, and slippage before computing; gross PF overstates edge. |
| Sample size matters | Under 30 trades is noise; 200+ trades gives reasonable confidence; 500+ is robust. |
| Segment by setup | Compute PF per setup tag to find where your edge concentrates and which setups to cut. |
| Backtest PF degrades | Expect 15–30% degradation from backtest to live trading; pad expectations accordingly. |
| Disciplineaiapp automates this | Disciplineaiapp tracks net-of-fees PF by setup tag, flags low-sample segments, and scores execution gaps between planned R and realized PF. |
The metric that traders misuse most
Profit factor is the most cited performance metric in trading communities and, in my view, the most consistently misread. The problem isn't the formula. It's that traders treat a single PF number as a verdict when it's actually a question.
A PF of 1.8 from 40 trades tells you almost nothing. The same number from 400 trades across three different market regimes tells you something real. The distinction matters enormously in practice, yet most traders skip straight to the ratio and start making sizing decisions.
The other thing worth saying plainly: a high PF in backtests should make you suspicious, not confident. The strategies that survive optimization look great on paper because they were built to look great on that specific paper. Walk-forward testing and out-of-sample validation aren't optional steps for cautious traders; they're the minimum standard for anyone who plans to risk real capital.
Where PF genuinely earns its keep is in segmented live analysis. When you can see that your trend-continuation trades run at 2.1 while your counter-trend trades sit at 0.5, you have a concrete decision in front of you. That's the version of profit factor worth tracking obsessively. The aggregate account number is mostly noise.
Disciplineaiapp tracks your profit factor so you can act on it
Calculating PF in a spreadsheet works until it doesn't. When you're running multiple setups across different sessions and tickers, the tagging and segmentation work compounds fast. Disciplineaiapp handles the heavy lifting automatically.

The platform computes net-of-fees profit factor by setup tag in real time, flags segments where sample size is too small to act on, and surfaces the gap between your planned R-to-R and your realized PF on every trade. That last piece is where most traders lose ground without realizing it. When you can see that your clean-execution trades run at 1.5 and your rule-break trades run at 0.8, the behavioral fix becomes obvious.
Disciplineaiapp also includes automated trade journaling, execution quality scoring, and behavioral coaching built around the same metrics covered in this guide. If you want to move from manual spreadsheet tracking to a workflow that surfaces these insights automatically, the AI Learning Center is the right starting point. Walkthroughs, setup guides, and live examples of PF segmentation are all there. Explore the platform at disciplineaiapp.com and see what your setups actually look like when the numbers are honest.
Useful sources
These are the primary references used throughout this guide. Each one adds something specific.
- TradeLens: Profit Factor Formula, Calculator & Guide — The most thorough single-page treatment of PF benchmarks, sample-size bands, and the outlier fragility problem. Validates the 1.3–1.8 range for consistently profitable retail traders and the 15–30% backtest degradation rule.
- NexusFi Academy: Profit Factor — Futures-focused, with concrete cost-structure examples showing how slippage and commissions collapse gross PF. Best source for the algebraic identity PF = (W ÷ (1 − W)) × R and the walk-forward methodology reference.
- OneTradeJournal: Profit Factor Calculator — Free calculator with plain-English explanations. Good for verifying your spreadsheet math and for the SPY/AAPL worked examples that illustrate small-sample fragility.
- TradingStats: Win Rate, Profit Factor & Expectancy — Explains why net-of-fees calculation is mandatory and how expectancy complements PF for account-progression decisions.
- TradeZella: How to Analyze Your Trading Performance — Practical segmentation examples, including the morning vs. afternoon PF split that illustrates how time-of-day analysis guides concrete decisions.
- Toastlytics: What Is Profit Factor? — Focused on the execution gap between planned R and realized PF, and why behavioral failures are the most common root cause of underperformance.
- CrossTrade: Profit Factor — Covers the overfitting red flag at PF > 3.0 and the regime-sensitivity problem. Useful for the out-of-sample testing and walk-forward validation sections.
When following any external example, check whether the PF shown is gross or net of fees. Most published examples use gross PF. The net number is the only one that reflects what your account actually keeps.