
Fair value gap trading is a price action method that identifies rapid three-candle imbalances, then uses the untraded zone left behind as a structured entry area on retracements. An FVG forms when a large middle candle expands so forcefully that the wicks of the first and third candles fail to overlap, leaving a visible price void. Traders treat that void as a zone where order flow was temporarily one-sided, making it a logical area to anticipate a reaction when price returns.
The core trade logic works like this:
- Identify the gap: Mark the zone between the high of candle 1 and the low of candle 3 (bullish), or the low of candle 1 and the high of candle 3 (bearish).
- Wait for retracement: Let price pull back into the gap rather than chasing the initial move.
- Enter at the midpoint: The Consequent Encroachment (CE), the 50% midpoint of the FVG, is the highest-probability entry level.
- Place your stop: Just beyond the far edge of the gap, where the setup is logically invalidated.
- Set your target: The next structural level, liquidity pool, or a minimum 1:2 risk-to-reward ratio.
- Confirm with higher timeframe trend: Alignment with the broader directional bias improves the probability of follow-through.
How to identify bullish and bearish fair value gaps
A bullish FVG forms during an upward impulse. Candle 1 closes, candle 2 surges higher with a large body, and candle 3 opens above candle 1's high wick. The gap sits between candle 1's high and candle 3's low. A bearish FVG is the mirror image: candle 2 drops sharply, and the zone falls between candle 1's low and candle 3's high.
Confirming a valid FVG requires more than spotting three candles:
- Non-overlapping wicks: The outer candles must leave a clear void. If their wicks touch or cross, no FVG exists.
- Displacement context: The middle candle should break away from prior consolidation, not just be a slightly larger candle inside a range.
- Session timing: Gaps formed during the New York open or London-New York overlap carry more weight than those printed during thin overnight sessions.
- Preceding structure: A gap following a Break of Structure or Change in Character on the higher timeframe is far more meaningful than a random impulse mid-range.
Small gaps inside choppy, overlapping price action are noise. The practical test is whether the middle candle genuinely displaced price away from a prior balance zone. If it did, the FVG is worth marking. If it formed inside random back-and-forth, skip it.
Pro Tip: Mark FVG boundaries with a horizontal box on your chart, not just lines. The full zone gives you a visual reference for the CE midpoint and the far edge where your stop belongs.
Why fair value gaps reflect institutional order flow
FVGs are visual signatures of order flow imbalances where liquidity was scarce during a rapid price move. When aggressive buying or selling outpaces available counterparties, price reprices sharply, skipping levels that would have been traded under normal conditions. That skipped zone is the FVG.
One distinction traders frequently miss: an FVG on a price chart is not the same as an order imbalance on a limit order book. Order imbalances in the traditional sense refer to unmatched buy or sell orders that can trigger trading halts on exchanges. FVGs reflect price movement velocity and efficiency on a candlestick chart. Confusing the two leads to misapplied analysis.
Two additional concepts sharpen FVG analysis considerably. A mitigated FVG is one that price has already revisited and traded through. Once mitigated, the zone loses its relevance and should be removed from your chart. An Inverse FVG (IFVG) forms when price violates a standard FVG entirely, closing through the full zone. That broken gap then flips polarity: a bullish FVG that gets broken downward becomes a bearish IFVG, acting as resistance on any return to that zone. Failure is information, and IFVGs give you a structured way to use it.
Which timeframes and markets work best for FVG trading
Higher timeframe FVGs on the 15-minute, 30-minute, 1-hour, 4-hour, and daily charts produce stronger reactions and more reliable signals than lower timeframe gaps. Daily FVGs carry the most institutional significance, though they move too slowly for intraday execution. The 15-minute and 30-minute charts offer the best balance of signal quality and opportunity frequency for day traders working US equities.
Lower timeframe gaps (1-minute, 3-minute) are essentially noise. They need strict filtering and should only be used for entry refinement after a higher-timeframe bias is already established.
Best practices for timeframe and market selection:
- Stocks: 15-minute and 30-minute FVGs during the New York AM session (9:30–11:00 AM ET) for day trading; daily and 4-hour for swing trades.
- Forex: 1-hour and 4-hour FVGs during London and New York sessions; avoid gaps formed in the Asian session unless volume confirms the move.
- Futures: ES, NQ, and YM futures respond well to FVGs on 15-minute through 1-hour charts, especially around economic data releases.
- Crypto: Higher volatility means FVGs form frequently; filter aggressively for displacement and trend alignment, and favor 1-hour and 4-hour setups.
- Multi-timeframe workflow: Identify directional bias on the higher timeframe, then drop to a lower timeframe only to refine the entry once the bias is clear.
Practical FVG strategies, entries, and risk management
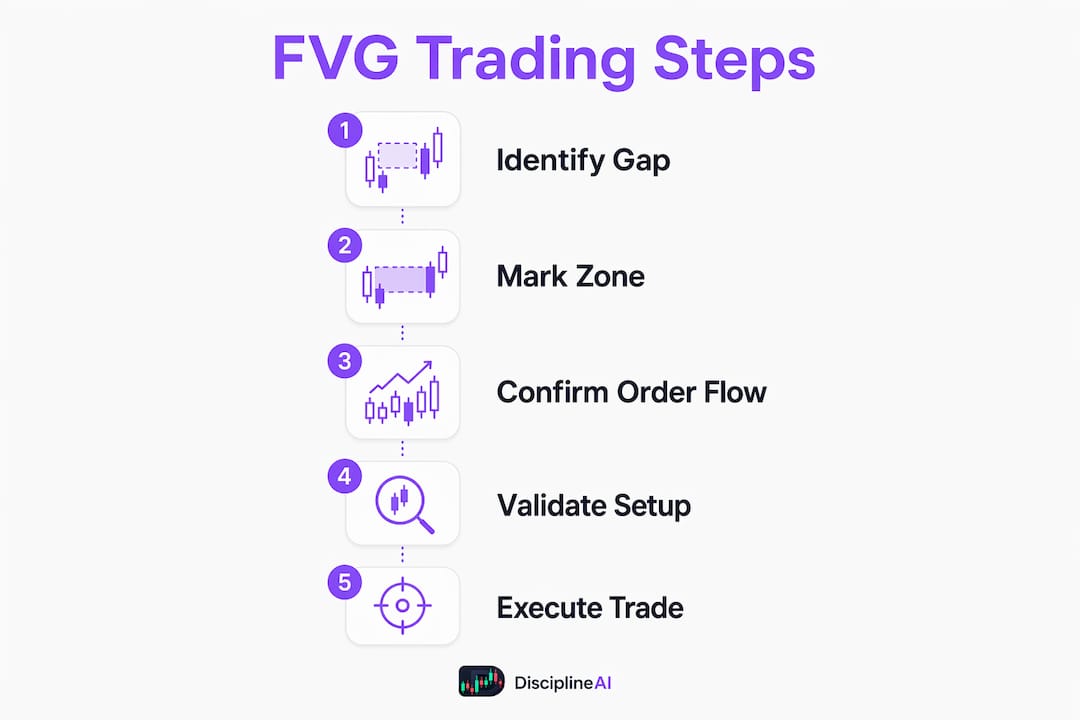
The step-by-step process for executing an FVG trade follows a consistent sequence regardless of asset class:
- Establish directional bias from higher timeframe market structure (higher highs and higher lows for bullish, lower highs and lower lows for bearish).
- Identify the FVG that formed during a displacement move aligned with that bias.
- Wait for retracement into the gap zone. Do not enter the moment price touches the near edge.
- Enter at the CE (50% midpoint) with a limit order. This level provides the tightest stop and best risk-to-reward.
- Place your stop just beyond the far edge of the FVG, plus a small buffer. For bullish trades, that means below candle 1's high wick. For bearish trades, above candle 1's low wick.
- Set your target at the next liquidity pool, opposing structure level, or a minimum 1:2 risk-to-reward ratio. Grade A setups with order block confluence can justify 3:1 to 5:1 targets.
- Exit immediately if price closes through the full FVG zone. Zone violation is not a reason to hold; it is a signal to exit.
A few risk management principles specific to FVG trading:
- Size positions by invalidation distance first. Calculate your stop distance in points or pips, then determine position size so the cash loss stays within your defined risk percentage per trade.
- FVG setups lose validity quickly if not triggered within four candles after formation. Institutional interest fades fast; expired gaps should be deleted from your chart.
- For traders operating under prop firm drawdown rules, re-entering a gap after a move has already run 1R in your favor often produces worse risk-to-reward than holding the original position.
- Confluence with an order block at the same zone improves win rates. OB plus FVG setups often outperform standalone FVGs according to practitioner experience.
Common mistakes to avoid:
- Entering at the near edge of the gap before any confirmation.
- Trading FVGs against the prevailing higher timeframe trend.
- Treating every gap as equal regardless of session timing or displacement quality.
- Waiting for a full gap fill before entering, which produces late entries and poor risk-to-reward.
- Ignoring mitigated gaps that have already been revisited and should be removed.
Pro Tip: Pair your FVG entries with a position size calculator. Enter your stop distance and account risk percentage before placing the order, not after. Sizing by invalidation distance keeps losses predictable even when the market moves fast.
Fair value gap trading across different asset classes
FVGs appear in every liquid market, but how they behave differs by asset class.
US equities produce some of the cleanest FVG setups because institutional order flow is concentrated around the cash open and major economic prints. A gap forming on the SPY or QQQ 15-minute chart during the first 30 minutes of the New York session, aligned with the prior day's trend, tends to fill or react at the CE with high consistency.

Forex pairs like EUR/USD and GBP/USD form FVGs most reliably during the London open and the London-New York overlap. A 1-hour bullish FVG on EUR/USD that forms after a Break of Structure and aligns with a higher timeframe uptrend gives you a defined zone to place a limit order, with a stop below the gap's lower boundary.
Crypto markets run 24 hours, which means FVGs form constantly, including during low-liquidity periods. Bitcoin and Ethereum on the 4-hour chart produce FVGs worth trading when they align with weekly structure. Gaps formed during weekend sessions or thin overnight periods carry far less weight. The AI pattern detection tools available today can help filter these by scanning for displacement conditions automatically.
Futures markets (ES, NQ, crude oil, gold) respond well to FVGs on the 15-minute through 1-hour charts. Gaps formed around FOMC announcements or CPI releases often represent genuine repricing rather than noise, making them high-quality candidates when they align with the prior trend.
How to backtest and validate your FVG strategy
Backtesting an FVG strategy requires more than scanning for three-candle patterns and counting fills. The quality of the setup matters as much as the pattern itself, so your backtest criteria need to reflect the filters you will actually apply in live trading.

Start by defining your rules precisely before touching historical data: which timeframe, which session hours, what displacement criteria, whether an order block must be present, and where the stop and target go. Vague rules produce misleading backtest results. Once rules are written, apply them consistently across at least 100 setups before drawing conclusions about win rate or expectancy.
Historical data APIs with granular price snapshots allow you to replay market conditions and test FVG setups under realistic conditions, including session timing and volume context. Market replay tools that simulate fog-of-war conditions, where you see only what was visible at the time of the trade, produce more honest results than reviewing charts with the benefit of hindsight.
Track not just win rate but also average winner size versus average loser size, maximum consecutive losses, and how often setups expire without triggering. An FVG strategy with a 60–75% win rate on properly filtered setups still requires a positive expectancy calculation to confirm it is worth trading live. Disciplineaiapp's market replay simulation with fog-of-war conditions is built for exactly this kind of structured validation, letting you stress-test your FVG rules against real historical price action before committing capital.
Key Takeaways
Fair value gap trading produces its best results when entries are taken at the CE midpoint with stops beyond the far gap edge, filtered by trend alignment and order block confluence.
| Point | Details |
|---|---|
| CE is the entry level | The 50% midpoint of the FVG provides the tightest stop and best risk-to-reward, not the near edge or full fill. |
| FVG fill rate with filters | Properly filtered FVG setups achieve 60–75% win rates on live data when aligned with trend and order block confluence. |
| Timeframe selection | 15-minute and 30-minute charts offer the best balance of signal quality and frequency for day trading US stocks. |
| Expiry rule | FVGs lose validity if not triggered within four candles; mitigated gaps should be deleted from your chart immediately. |
| OB plus FVG edge | Combining an order block with an FVG at the same zone improves win rates over standalone gaps. |
Disciplineaiapp helps you trade FVGs with structure and discipline

Identifying a fair value gap is the easy part. Executing with discipline, sizing correctly, and knowing when a zone has failed is where most traders lose their edge. Disciplineaiapp's AI-powered platform analyzes market structure, liquidity events, and multi-timeframe alignment to surface high-confluence trade setups, including FVG-based entries, with confidence scores and execution guidance built in.
The platform's trade journaling and performance analytics let you track every FVG setup you take, review your execution quality, and identify behavioral patterns that hurt your results. Whether you are trading crypto, forex, or futures, Disciplineaiapp gives you the data-driven framework to stop guessing and start trading with a repeatable process.
Explore the AI Learning Center to deepen your understanding of market structure, order flow, and the concepts that make FVG trading work at a professional level.