
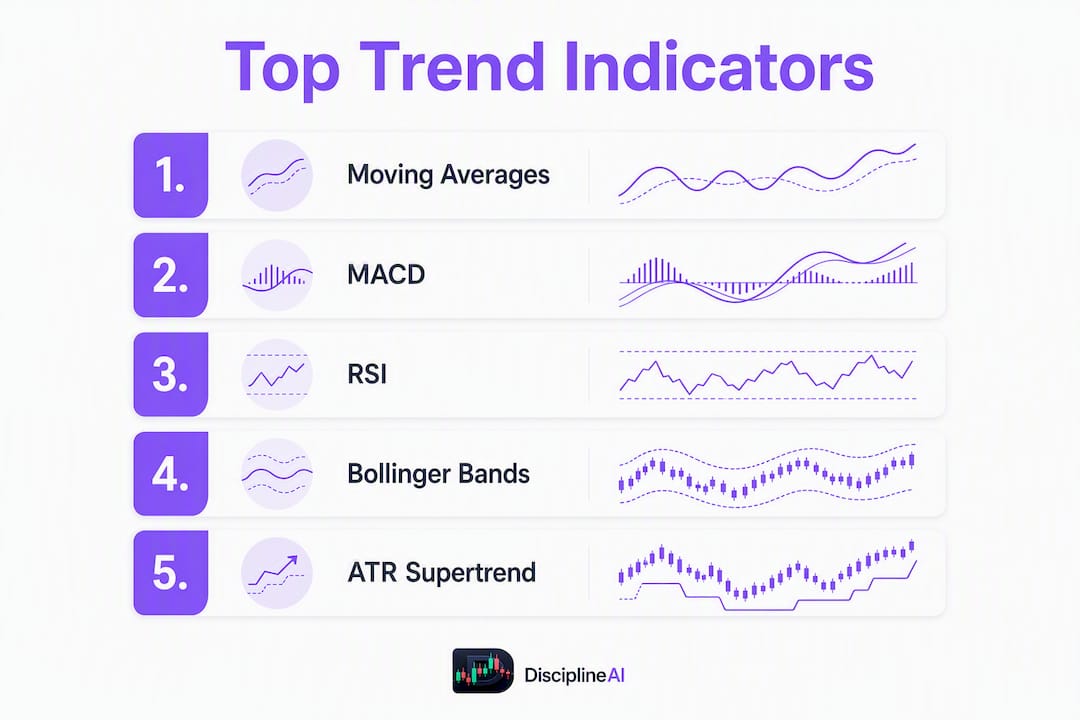
Moving averages, Supertrend/ATR, MACD, RSI, and Bollinger Bands are the best trend indicators for most traders. Each handles a specific job: moving averages filter trend direction, ATR and Supertrend set volatility-adjusted stops, MACD confirms momentum, RSI measures strength and spots reversals, and Bollinger Bands flag volatility regimes and breakout conditions. Start with a use of an EMA as your trend filter, add ATR or Supertrend for dynamic stops, then layer in one momentum oscillator (MACD or RSI) for confirmation. That three-part stack covers entry logic, stop placement, and momentum context without redundancy.
Quick-start priority list:
- Trend filter: 20 EMA or 50 EMA (direction bias)
- Volatility stop: ATR or Supertrend set as volatility stops using typical default settings
- Momentum confirmation: MACD or RSI with standard default periods and commonly used overbought/oversold thresholds
- Breakout/squeeze detection: Bollinger Bands (20 SMA, 2 standard deviations)
Platforms like Disciplineaiapp synthesize all four signal layers automatically, outputting a confidence score and ATR-based stop suggestion so you spend less time toggling between charts and more time executing with a clear plan.
Table of Contents
- Top trend indicators at a glance
- 1. Moving averages (SMA and EMA): your first trend filter
- 2. MACD: momentum confirmation, divergence, and a concrete trade rule
- 3. RSI: reading trend strength and timing pullback entries
- 4. Bollinger Bands: using volatility to spot breakouts and mean-reversion
- 5. ATR and Supertrend: volatility stops and regime detection
- 6. ADX: filtering for trend strength before you trade
- 7. OBV: confirming trends with volume
- 8. How to combine indicators into setups that actually work
- 9. Common mistakes and how to avoid them
- 10. How Disciplineaiapp synthesizes trend signals in practice
- Key Takeaways
- Why most traders use too many indicators
- Disciplineaiapp automates what takes most traders years to build
- Sources and further reading
Top trend indicators at a glance
| Indicator | Primary Job | Default Settings | Best Timeframe |
|---|---|---|---|
| SMA | Trend direction, support/resistance | 20, 50, 200 periods | Swing, position |
| EMA | Faster trend filter, crossovers | 9, 20, 50 periods | Day, swing |
| MACD | Momentum confirmation, divergence | 12/26/9 | Day, swing |
| RSI | Strength assessment, reversal signals | 14 periods, 70/30 | All timeframes |
| Bollinger Bands | Volatility regime, squeeze/breakout | 20 SMA, 2 std dev | Day, swing |
| ATR | Volatility measurement, stop sizing | 14 periods | All timeframes |
| Supertrend | Volatility-adjusted trend filter/stop | 10 ATR, 3x multiplier | Swing (7 ATR, 2x for scalp) |
| ADX | Trend strength filter | 14 periods, threshold ~25 | Swing, position |
| OBV | Volume confirmation | Cumulative (no period) | Day, swing |
| MACD Histogram | Momentum exhaustion, early divergence | Same as MACD | Day, swing |

On-chart vs. off-chart: Moving averages, Bollinger Bands, Supertrend, and ATR plot directly on the price chart. MACD, RSI, ADX, and OBV sit in separate panels below. Mixing both types gives you price structure context alongside momentum readings, which is how professional setups are typically built.
1. Moving averages (SMA and EMA): your first trend filter
Moving averages are the foundation of trend analysis. EMA favors recent prices and responds faster to new data, making it the go-to for active traders. SMA weights all periods equally, which makes it smoother and better suited for identifying longer-term support and resistance zones.

SMA vs. EMA: which one for which job
Use EMA when you need a responsive filter for day trading or swing entries. The 9 EMA and 20 EMA are common on intraday charts; the 50 EMA is a reliable swing-trade filter. SMA works better for position traders watching the 200-period line as a major trend anchor.
Common lengths and what they mean:
- 9/20 EMA: Short-term momentum and intraday trend direction
- 50 EMA/SMA: Intermediate trend filter; price above = bullish bias
- 200 SMA: Long-term trend anchor; widely watched by institutional traders
Basic MA crossover setup (step by step):
- Plot a 20 EMA and 50 EMA on a daily or 4-hour chart
- Enter long when the 20 EMA crosses above the 50 EMA and price is above both lines
- Set your initial stop 1x ATR below the most recent swing low
- Exit when the 20 EMA crosses back below the 50 EMA, or when price closes below the 50 EMA on two consecutive candles
Chart annotation guide: Mark the crossover candle, the slope direction of both MAs, and where price sits relative to each line. A rising 50 EMA with price above it is the cleanest bullish setup; a flat or declining 50 EMA signals chop, not trend.
Pro Tip: Before acting on a crossover signal, check the same MA relationship on one timeframe higher. A 20/50 EMA cross on the 1-hour chart carries far more weight when the 4-hour chart's 50 EMA is also sloping upward.
2. MACD: momentum confirmation, divergence, and a concrete trade rule
MACD is best used as a momentum-confirmation tool, not a standalone entry trigger. It measures whether two moving averages are converging or diverging, which tells you whether momentum is building or fading.
Three components, one job:
- MACD line: Difference between the 12 EMA and 26 EMA
- Signal line: 9-period EMA of the MACD line
- Histogram: Visual gap between the MACD line and signal line; shrinking bars = momentum fading
Practical uses:
- Trend confirmation: MACD above zero and rising = bullish momentum aligned with trend
- Divergence: Price makes a new high but MACD histogram makes a lower high = momentum exhaustion warning
- Centerline cross: MACD crossing above zero confirms a shift from bearish to bullish momentum
Concrete trade rule using 12/26/9 defaults: Enter long when price is above the 50 EMA (trend filter), MACD line crosses above the signal line, and the histogram turns positive. Place your stop 1x ATR below the entry candle's low. Exit when the histogram turns negative for two consecutive bars or when price closes below the 50 EMA.
MACD lags because it is built from moving averages. In choppy, sideways markets it generates frequent false crossovers. Adding an ADX filter (values above 25 signal a trending regime) cuts a significant portion of those bad signals before they reach your order entry.
Pro Tip: Watch the histogram bars, not just the line crossover. When bars are shrinking toward zero while price is still moving in your direction, that is often the earliest warning that momentum is fading before the lines actually cross.
3. RSI: reading trend strength and timing pullback entries
RSI is a momentum oscillator that measures the speed and magnitude of recent price changes on a 0–100 scale. It is best used to assess trend strength and spot potential reversals, not as a standalone buy/sell trigger.
How RSI behaves in trending markets: In a strong uptrend, RSI tends to stay above 50 and often oscillates between 50 and 80 without reaching oversold territory. A reading that drops below 50 in what you thought was an uptrend is an early warning that the trend may be weakening.
Three concrete use cases:
- Pullback entry within a trend: In an uptrend, wait for RSI to pull back to the 40–50 zone, then re-enter when it turns back up. This avoids chasing extended moves.
- Divergence confirmation: Price makes a new high but RSI makes a lower high. That divergence often precedes a reversal, especially at key resistance levels.
- Range-fading setups: In a clearly defined range, fade moves when RSI hits 70 (short) or 30 (long), with a tight stop just outside the range boundary.
Default thresholds: The standard 14-period RSI with 70/30 levels works across most timeframes. In strong trending markets, some traders shift those thresholds to 80/20 to avoid getting shaken out of a trend prematurely.
Pro Tip: Shorten RSI to 9 periods on intraday charts for faster signals, and always pair it with a trend filter. An RSI reading of 30 in a confirmed downtrend is not a buy signal; it is a continuation signal.
4. Bollinger Bands: using volatility to spot breakouts and mean-reversion
Bollinger Bands visualize volatility and give you two distinct trading opportunities depending on how the bands are behaving: mean-reversion when price touches the outer bands in a range, and breakout when the bands squeeze then expand.
How the default setup works: The standard configuration is a 20-period SMA with bands set at 2 standard deviations above and below. Bands widen as volatility increases and contract during quiet periods. That contraction, called a squeeze, often precedes a sharp directional move.
Three setups with exact chart annotations:
- Squeeze breakout: When bands narrow to their tightest point in 20+ bars, prepare for a breakout. Wait for a candle to close outside the band with above-average volume before entering. Mark the squeeze point on your chart.
- Mean-reversion: In a ranging market, price touching the upper band is a potential short; lower band is a potential long. Annotate the midline (20 SMA) as your target.
- Band walk: In a strong trend, price can "walk" along the upper or lower band for extended periods. This is not an overbought signal. Mark where price stops closing outside the band as a potential trend exhaustion point.
Combining bands with momentum: A Bollinger Band squeeze alone does not tell you direction. Add RSI or MACD to determine which way momentum is leaning before the breakout. A squeeze with RSI above 55 and rising favors an upside break.
Pro Tip: Adjust the standard deviation multiplier to 2.5 on volatile assets like crypto. The wider bands reduce the number of false "band touch" signals in high-volatility regimes.
5. ATR and Supertrend: volatility stops and regime detection
ATR quantifies how much an asset moves on average over a given period. Supertrend takes that ATR reading and builds a volatility-adjusted trailing trend line directly on the price chart. Together, they are the most practical pairing for setting stops and detecting whether a market is trending or chopping.
How ATR works: ATR uses a 14-period lookback and measures the average of the true range (the largest of: current high minus low, current high minus previous close, current low minus previous close). A rising ATR means expanding volatility; a falling ATR means the market is quieting down.
How Supertrend uses ATR: Supertrend plots a line above or below price based on an ATR multiple. The default settings are a 10-period ATR with a 3x multiplier, which works well for swing trading. For scalping, a 7-period ATR with a 2x multiplier produces faster flips.
Three practical rules:
- ATR-based stop: Multiply the current ATR by 1.5–2x and subtract from your entry price for a long stop. This keeps your stop proportional to current volatility rather than a fixed dollar amount.
- Supertrend trailing stop: Once in a trade, trail your stop to the Supertrend line. Exit when price closes on the opposite side of the line.
- Regime detection via flip frequency: If Supertrend flips direction more than three or four times within 20 bars, the market is chopping. Stand aside until flips slow down.
Pro Tip: Track how often Supertrend flips over a rolling 20-bar window. Frequent flips are a regime signal, not a trading signal. When you see them, reduce position size or wait for the regime to clarify. You can read more about volatility indicators and how they interact with trend tools.
6. ADX: filtering for trend strength before you trade
ADX measures trend strength on a 0–100 scale without telling you direction. That distinction matters. A rising ADX above 25 tells you a trend is strong enough to trade with momentum tools; a reading below 20 tells you the market is ranging and crossover signals are likely to fail.
ADX works best as a gating filter. Before acting on a MACD crossover or EMA signal, check ADX. If it is below 20, skip the trade. If it is above 25 and rising, the signal carries more weight. ADX values above 25 typically indicate a strong trend, while values below 20 suggest a ranging environment where trend-following tools underperform.
Pair ADX with directional movement indicators (+DI and -DI) to get direction. When +DI is above -DI and ADX is above 25, that is a confirmed uptrend worth trading. The reverse signals a confirmed downtrend.
7. OBV: confirming trends with volume
On-Balance Volume accumulates volume by adding it on up-days and subtracting it on down-days. The result is a running total that often moves before price does. OBV can diverge from price to warn of potential reversals, making it one of the more useful confirmation tools available.
If price is making new highs but OBV is flat or declining, institutional participation is not supporting the move. That divergence is a warning, not a buy signal. Conversely, OBV making new highs ahead of price often signals that smart money is accumulating before a breakout.
Use OBV as a secondary confirmation layer, not a primary signal. In the intraday breakout setup described later, OBV rising alongside a Bollinger Band squeeze confirms that volume is building behind the potential move.
8. How to combine indicators into setups that actually work
The rule is simple: one trend filter, one volatility stop, one momentum confirmation. Stacking two oscillators that measure the same thing (RSI and Stochastic, for example) adds noise without adding information.
Three tested setups:
Setup 1: Swing trend-follow (An EMA plus Supertrend and MACD)
- Trend filter: Price above 50 EMA on the daily chart
- Regime check: Supertrend green (bullish) on the daily
- Entry trigger: MACD line crosses above signal line on the 4-hour chart
- Stop: 1.5x ATR below entry candle low
- Timeframe: Swing (daily/4-hour)
Setup 2: Intraday breakout (Bollinger Bands squeeze + OBV + ATR stop)
- Setup condition: Bollinger Band squeeze on the 1-hour chart (bands at 20-bar minimum width)
- Confirmation: OBV trending upward during the squeeze
- Entry: First candle close outside the upper band with volume above the 20-bar average
- Stop: 1x ATR below the breakout candle low
- Timeframe: Day trading (1-hour/15-minute)
Setup 3: Pullback entry (20 SMA + RSI + ATR stop)
- Trend filter: Price above 20 SMA on the 4-hour chart
- Entry trigger: RSI pulls back to 40–50 zone, then turns back above 50
- Stop: 1x ATR below the pullback low
- Timeframe: Swing (4-hour/daily)
Timeframe matrix:
| Setup | Scalp | Day | Swing | Position |
|---|---|---|---|---|
| An EMA plus Supertrend and MACD | No | Possible | Best fit | Yes (adjust periods) |
| BB Squeeze + OBV + ATR | No | Best fit | Possible | No |
| 20 SMA + RSI + ATR | No | Possible | Best fit | Yes |
Rules for avoiding redundancy:
- Never pair two oscillators that both measure overbought/oversold (RSI + Stochastic)
- Never use two moving averages of the same type as both filter and signal (two SMAs without a volatility layer)
- Always include one volatility-based stop (ATR or Supertrend); a fixed pip/dollar stop ignores market conditions
- Use ADX to filter before applying crossover signals in sideways markets
Backtest checklist before going live:
- Minimum 50 trades in the sample (100+ preferred)
- Test on out-of-sample data (at least 30% of your data set held back)
- Include realistic slippage and commissions in your P&L calculation
- Run a parameter stability test: if changing the EMA from 50 to 45 or 55 destroys the results, the system is overfit
- Test across at least two different market regimes (trending and ranging periods)
9. Common mistakes and how to avoid them
Indicators are lagging. Every signal they generate is based on what already happened. Managing that expectation before you risk real capital is the single most important mindset shift a new trader can make.
What not to do:
- Overcrowding your chart: More than three or four indicators creates analysis paralysis, not clarity. If you cannot explain your setup in one sentence, it is too complex.
- Parameter-tweaking to fit past data: Adjusting your RSI from 14 to 11 because it would have caught a specific trade is overfitting. The market does not owe you that trade again.
- Trading every signal regardless of regime: A MACD crossover in a flat, low-ADX market is noise. Context matters more than the signal itself.
- Ignoring volatility and direction as separate concepts: Bollinger Bands tell you volatility is expanding; they do not tell you which direction price will move. Treating a band touch as a directional signal without confirmation is a common and costly error.
Risk management checklist:
- Set stops using ATR multiples, not round numbers or gut feel
- Size positions so that a stop-out costs no more than 1–2% of your account
- Define a maximum daily drawdown limit (e.g., 3% of account) and stop trading when you hit it
- Keep a trade journal; log your entry reason, the indicator signals present, and the outcome. Reviewing performance patterns by regime reveals which setups actually work for you
Pro Tip: After a losing streak, do not change your parameters. Review your journal for regime context first. Most losing streaks happen because a setup designed for trending markets was applied during a choppy period, not because the setup is broken.
10. How Disciplineaiapp synthesizes trend signals in practice
AI-driven signal synthesis works by layering the same indicators you have just read about, but doing it consistently across dozens of assets and timeframes simultaneously, without the emotional interference that causes most traders to skip steps.
Here is how Disciplineaiapp approaches a trade setup, step by step:
Worked example: BTC/USD, daily chart Step 1 — Trend filter: Is price above the 50 EMA? Yes. Bullish bias confirmed. Step 2 — Regime check: Is Supertrend green with fewer than three flips in the last 20 bars? Yes. Trending regime confirmed. Step 3 — Momentum confirmation: Has MACD crossed above its signal line with the histogram turning positive? Yes. Momentum aligned. Step 4 — Stop calculation: ATR calculated for stop placement proportionally below entry price. Step 5 — Confidence score output: Three of three filters aligned, low flip frequency, volume (OBV) rising. Disciplineaiapp outputs a high-confidence setup with suggested entry zone, stop level, and position size based on account risk parameters.
The platform tracks metrics like signal stability by regime, win-rate by indicator combination, and average drawdown per setup type. That data feeds back into the engine continuously, so the confidence scores reflect actual historical performance rather than theoretical backtests alone. Traders can review the AI signal pipeline to understand exactly which inputs drove a specific score.
What to expect from an AI output:
| Output | What it means |
|---|---|
| Confidence score | Percentage of historical setups with similar filter alignment that were profitable |
| Suggested stop | ATR-based level calculated from current volatility |
| Position size | Calculated from account risk % and stop distance |
| Regime tag | Trending, ranging, or high-volatility warning |
| Signal stability | How consistent the setup has been across recent bars |
Transparency matters here. A good AI output tells you why it generated a signal, not just that it did. Disciplineaiapp's evidence-before-execution approach shows the indicator logic behind every setup, so you can evaluate it rather than blindly follow it.
Key Takeaways
The most effective approach to trend trading is combining a directional filter (moving average), a volatility-adjusted stop (ATR or Supertrend), and one momentum oscillator (MACD or RSI) into a single, non-redundant setup matched to your timeframe.
| Point | Details |
|---|---|
| Start with three layers | Use a trend filter, volatility stop, and one momentum oscillator — never more than four indicators total. |
| Match settings to timeframe | Supertrend defaults (10 ATR, 3x) suit swing trading; faster settings (7 ATR, 2x) work better for scalping. |
| ATR-based stops are non-optional | Fixed stops ignore volatility; ATR multiples keep your stop proportional to current market conditions. |
| ADX filters out bad signals | Check ADX before acting on crossovers; values below 20 mean the market is ranging and signals will fail more often. |
| Disciplineaiapp automates synthesis | The platform layers trend, regime, momentum, and volume signals into a confidence score with an ATR-based stop suggestion. |
Why most traders use too many indicators
The conventional wisdom says more indicators equal more information. After watching traders work through setups, the opposite is almost always true. A chart covered in six oscillators does not produce better decisions; it produces hesitation. Every extra indicator adds a condition that must align before you act, and in a fast-moving market, waiting for perfect alignment means missing the trade entirely or entering so late that the risk/reward has collapsed.
The traders who perform consistently tend to have the simplest charts. One trend filter. One stop tool. One confirmation signal. They know exactly what each line means, they know which regime it works in, and they stop trading when the regime does not match. That last part is where most people fail. They keep applying a trend-following setup in a choppy market because they do not want to sit on their hands.
Supertrend flip frequency is the most underrated regime signal available. When that line flips direction repeatedly over a short window, the market is telling you something: there is no trend to follow. The right response is to reduce size or step aside entirely, not to find a different indicator that might justify a trade. The discipline to do nothing is harder to build than the skill to read a chart, and it is worth far more in the long run.
Journaling by regime is the fastest way to figure out which setups actually work for you. After 50 trades, sort your journal by market condition (trending vs. ranging) and look at your win rate in each bucket. Most traders discover that one setup accounts for the majority of their profits, and the rest of their trades are noise. That discovery alone is worth more than any new indicator you could add to your chart. Pair that self-knowledge with AI-assisted trading psychology tools and the feedback loop tightens considerably.
Disciplineaiapp automates what takes most traders years to build
Reading about indicator combinations is one thing. Applying them consistently across multiple assets, timeframes, and market regimes without letting emotion override your rules is another problem entirely.

Disciplineaiapp handles the synthesis layer automatically. The platform scans for 50 EMA trend alignment, Supertrend regime confirmation, MACD momentum signals, and ATR-based stop levels across crypto, forex, and stock markets simultaneously, then outputs a confidence score and execution guidance for each setup it identifies. You get multi-timeframe alignment, automated trade journaling, behavioral coaching when your patterns drift, and stand-aside protection that flags when the regime does not support trading.
This is not financial advice. Test any new setup on paper or a small account before committing real capital. When you are ready to see how AI-driven indicator synthesis works in practice, start with Disciplineaiapp and run the platform alongside your existing charts for a few weeks. The comparison tends to be instructive.
Sources and further reading
-
Trend Trading: The 4 Most Common Indicators — Investopedia: Covers MACD, RSI, OBV, and moving averages with default parameters and practical interpretation. A solid starting reference for any trader building their first setup.
-
Discover Volatility Indicators and Tools — OANDA: Explains ATR and Bollinger Bands in depth, including how to use them together for stop-setting and volatility regime detection.
-
Supertrend Indicator: Complete ATR Trading Guide — Quantum-Algo: The most detailed publicly available guide to Supertrend defaults, timeframe adjustments, and flip-frequency regime interpretation.
-
Indicators to Build a Trend-Following Strategy — QuantInsti: Practical walkthrough of ADX as a trend-strength filter and how to combine it with directional tools to reduce false signals.
-
Best Trading Indicators — Vantage Markets Academy: Accessible overview of SMA vs. EMA differences and when active traders prefer one over the other.
-
Are These the 8 Best Volatility Indicators? — IG: Useful for understanding how volatility and trend indicators complement each other and the common mistake of conflating the two.
-
Top Volatility Indicators Every Trader Must Know — Scalping-Algo: Partner resource covering ATR, Supertrend, and related volatility tools with implementation notes for different trading styles.
-
Momentum Oscillator Indicator for TradingView — Scalping-Algo: Partner resource on momentum oscillator implementations and divergence detection, useful for MACD and RSI application in live charts.
-
The 10 Most Popular Trading Indicators — Saxo: Broad overview of indicator categories including oscillators, volatility tools, and trend-following indicators with clear explanations of each.
For deeper study: John J. Murphy's Technical Analysis of the Financial Markets remains the most thorough single-volume reference for indicator mechanics and combination logic. J. Welles Wilder's New Concepts in Technical Trading Systems is the original source for ATR, RSI, and the Parabolic SAR, and reading it gives you the formula intuition that most online guides skip.