
Set your stop at entry minus (ATR × multiplier). That's the whole formula. If ATR(14) reads 1.50 on a stock you're buying at $50, a 2× multiplier gives you a stop at $47.00. Everything else — the multiplier choice, the period, the trailing method — is about making that distance fit your style and keeping your dollar risk constant when volatility shifts.
Recommended multipliers by trading style:
- Scalping: 0.75×–1.25× ATR (tight, fast exits)
- Day trading: 1.0×–1.5× ATR (filters intraday noise without wide exposure)
- Swing trading: 1.5×–2.5× ATR (room for multi-day moves)
- Trend following: 2.0×–3.0× ATR (wide enough to survive pullbacks)
Quick worked example: Stock entry at $100, ATR(14) = $2.00, multiplier = 2×. Stop distance = $4.00. Stop price = $96.00.
Pro Tip: When ATR expands and your stop distance widens, cut your position size proportionally. Wider stop, fewer shares — that's how dollar risk stays flat.
Table of Contents
- What does ATR actually measure, and how do you calculate it?
- How to set a basic fixed ATR stop
- How does an ATR trailing stop work?
- What is the Chandelier Exit and how does it differ?
- How do you convert ATR to a percentage stop?
- How do you adapt ATR stops when volatility regimes change?
- Which ATR period and timeframe should you use?
- Worked examples: calculating ATR stops and position size
- Position sizing: keeping dollar risk flat when ATR changes
- Common mistakes traders make with ATR stops
- Key Takeaways
- ATR stops are a tool, not a trading system
- Disciplineaiapp puts ATR stop rules to work automatically
- Useful sources for further reading
What does ATR actually measure, and how do you calculate it?
ATR measures volatility, not direction. It tells you how much a market typically moves over a given period, accounting for gaps and overnight moves that a simple high-low range would miss.
The True Range for any single bar is the largest of three values: the current high minus the current low, the absolute value of the current high minus the prior close, and the absolute value of the current low minus the prior close. ATR is then a moving average of those True Range values, typically over 14 periods, though 20 and 21 are also common defaults on platforms like StockCharts and TradingView.
A quick numeric example: if a stock's True Range readings over three days are $1.20, $1.80, and $1.50, a simple average gives you $1.50 as a rough ATR. The actual Wilder-smoothed ATR weights prior values, so the number converges more slowly, but the concept is identical. Most charting platforms, including StockCharts, expose ATR as a standard indicator with a 14 or 21-period default you can drop onto any chart in seconds.
One thing ATR cannot tell you: which direction price will move. It's a pure volatility reading. A rising ATR means the market is moving more, not that it's moving up.
How to set a basic fixed ATR stop
This is the foundation. Every other method in this article builds on it.
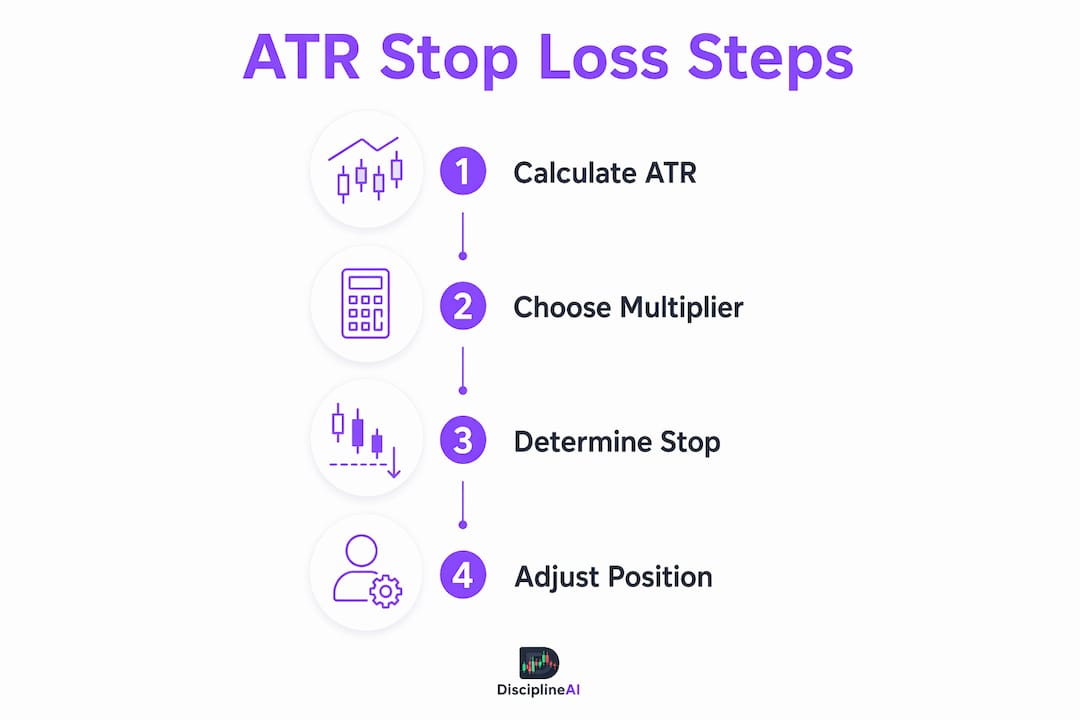
- Pull up ATR on your entry timeframe. Use ATR(14) as your starting point. Read the current value at the bar where you're entering.
- Choose your multiplier. Day traders typically use 1.0×–1.5×; swing traders 1.5×–2.5×; trend followers 2.0×–3.0×; scalpers can go as low as 0.75×.
- Compute stop distance. Multiply ATR by your chosen multiplier. That's how far your stop sits from entry.
- Place the stop. For a long trade: stop = entry price minus stop distance. For a short: stop = entry price plus stop distance.
- Recalculate position size. Divide your max dollar risk per trade by the stop distance (times unit value). Never skip this step.
Worked calculation: You enter a long on a stock at $75.00. ATR(14) = $1.80. You choose a 2× multiplier. Stop distance = $3.60. Stop price = $71.40. If your max risk per trade is $300, you can buy 83 shares ($300 ÷ $3.60).
The main advantage of this approach is objectivity. The stop is set by the market's own volatility, not by a round number or a gut feeling. The limitation is that a fixed ATR stop ignores structure. A stop placed $3.60 below entry might land in the middle of a consolidation zone, where it's likely to get hit by normal noise. Combining ATR distance with a nearby support level gives you a more defensible placement.

How does an ATR trailing stop work?

A trailing stop moves with price, but only in the direction of the trade. It never moves backward. That one-way ratchet is what separates it from a fixed stop.
The rule is simple: after entry, recalculate your stop at each new bar close. For a long, the stop equals the current close minus (ATR × multiplier). If that new level is higher than the previous stop, move the stop up. If it's lower, leave it where it is. The stop only climbs.
Step-by-step example (long trade):
| Bar | Close | ATR(14) | 2× ATR | New Stop | Active Stop |
|---|---|---|---|---|---|
| Entry | $98.50 | $2.00 | $4.00 | $96.00 | $96.00 |
| Bar 2 | $102.50 | $2.00 | $4.00 | $98.50 | $98.50 |
| Bar 3 | $100.80 | $2.00 | $4.00 | — | $98.50 (no move down) |
| Bar 4 | — | $1.80 | $3.60 | $100.80 | $100.80 |
At Bar 3, price dipped but the stop held at $98.50 because moving it down would increase risk. By Bar 4, a new high pushed the stop up to $100.80, locking in a profit cushion above entry.
Update frequency matters. Recalculating on bar close is standard and avoids reacting to intrabar spikes. Intrabar updates can trigger premature exits on volatile instruments. On very short timeframes (1-minute, 5-minute charts), small ATR values mean the stop sits close to price, so consider using a longer ATR period or a higher multiplier to filter noise.
Pro Tip: On timeframes below 15 minutes, use ATR(20) or ATR(21) instead of ATR(14) to smooth out the choppiness that can whipsaw a tight trailing stop.
What is the Chandelier Exit and how does it differ?
The Chandelier Exit is a specific version of the ATR trailing stop, and the key difference is what it anchors to. Instead of trailing from the most recent close, it anchors from the highest high (for longs) or lowest low (for shorts) reached since entry.
Formula for a long position: Chandelier Stop = Highest High over lookback period minus (ATR × multiplier)
The typical starting parameters are a 22-period lookback and a 3× ATR multiplier for conservative trend following. Swing traders often tighten to 2.5× with a 20-period lookback.
Worked example: Highest high over 22 bars = $110.00. ATR(22) = $2.50. Multiplier = 3×. Chandelier Stop = $110.00 minus $7.50 = $102.50.
The ratchet behavior means the stop can only move up (for longs). When price makes a new high, the anchor resets higher and the stop follows. When price reverses and breaches the stop, that's the exit signal, and the indicator flips to a short-side stop. Volatility stops like the Chandelier are best used as trailing exits after entry signals from other methods. The flip is a trend invalidation signal, not an entry trigger on its own.
When the Chandelier works well and when it doesn't:
- Works well in sustained trends with clean higher highs
- Works well when you need an objective, emotion-free exit rule
- Struggles around gap events (earnings, Fed announcements) where price jumps past the stop
- Underperforms in choppy, range-bound markets where frequent flips generate losses
Giving back some open profit before the stop fires is expected. That give-back is the cost of staying in a trend long enough to capture the bulk of the move. Treating it as a failure of the indicator is a misread of how it's designed to work.
How do you convert ATR to a percentage stop?
The ATR percentage stop converts the raw ATR dollar value into a percentage of price. The formula: ATR% = ATR ÷ Current Price × 100.
This matters most when you're trading multiple instruments at different price levels. A $2.00 ATR means something very different on a $20 stock versus a $200 stock. Converting to percent gives you a consistent risk lens across your whole portfolio.
Stock example: Stock at $150, ATR(14) = $3.00. ATR% = 3.00 ÷ 150 × 100 = 2.0%. A 2× stop sits 4.0% below entry.
Forex example: EUR/USD at 1.0850, ATR(14) = 0.0065 (65 pips). ATR% = 0.0065 ÷ 1.0850 × 100 = 0.60%. For a standard lot (100,000 units), each pip is worth $10, so 65 pips = $650 stop distance per lot.
ATR percentage stops are particularly useful for screening trades. If your rule is "only take trades where ATR% is below 3%," you can filter out instruments that are too volatile for your account size before you even look at a chart. The downside compared to absolute ATR stops: percentage stops don't account for the dollar value of a move in futures or leveraged instruments, where unit value matters as much as the percentage distance.
How do you adapt ATR stops when volatility regimes change?
Volatility isn't constant. ATR expands before and after major events, contracts during quiet consolidations, and spikes on news. Using the same multiplier in every regime is how traders get stopped out unnecessarily or hold too long when conditions shift.
Detecting regime changes:
- ATR trending higher over 5–10 bars signals expansion. Widen your multiplier or reduce position size.
- ATR compressing to multi-week lows signals a squeeze. Tighter stops may work, but breakout risk is high.
- Compare current ATR to its 20-period average. If current ATR is more than 1.5× its average, you're in an elevated-volatility regime.
Adjustment template:
| Regime | ATR Period | Multiplier Adjustment | Size Adjustment |
|---|---|---|---|
| Normal | 14 | Standard (2×–2.5×) | Full |
| Expanding | 14–20 | Add 0.5× to multiplier | Reduce position size proportionally |
| Compressed | 14 | Reduce multiplier by 0.25× | Can increase slightly |
| Event risk (earnings, FOMC) | 20–22 | Add 0.5×–1× or stand aside | Reduce 50%+ |
Around earnings or Fed days, the safest rule is often to stand aside entirely or cut size in half and widen the stop by at least one full ATR multiple. The gap risk alone can blow through any stop. For crypto risk management, where 24/7 markets and weekend gaps are common, using ATR(20) or higher and a 2.5× minimum multiplier is a reasonable baseline.
Quick execution checklist for regime changes:
- Check ATR vs. its 20-period average before entering
- If ATR is elevated, recalculate position size before placing the order
- Log the regime in your trade journal so you can review performance by volatility environment
Which ATR period and timeframe should you use?
The right ATR period depends on your trading style. Mismatching a short ATR period to a long-term trade, or vice versa, produces stops that are either too tight or too wide for the moves you're trying to capture.
Traders typically select ATR periods and multipliers based on trading style and timeframe to align stop distance with expected price movement; matching ATR timeframe to entry signal timeframe is critical to avoid overly tight stops.
Pro Tip: If you're trading a very short timeframe and finding your stops get hit constantly, try moving up one timeframe for your ATR calculation. A 15-minute ATR applied to a 5-minute entry gives the stop more breathing room without abandoning your entry logic.
The ATR Trailing Stops indicator on StockCharts defaults to 21 periods with a 3× multiplier, which is a reasonable starting point for daily swing trades. Adjust from there based on your backtest results.
Worked examples: calculating ATR stops and position size
Example A: equity swing trade (long)
- Stock: XYZ at $80.00 entry
- ATR(14) on daily chart: $2.40
- Multiplier: 2× (swing trade)
- Stop distance: $2.40 × 2 = $4.80
- Stop price: $80.00 minus $4.80 = $75.20
- Account risk per trade: $240
- Position size: $240 ÷ $4.80 = 50 shares
- Dollar exposure: 50 × $80.00 = $4,000
Example B: forex short trade (EUR/USD)
- Entry: 1.0900 (short)
- ATR(14) on 4H chart: 0.0080 (80 pips)
- Multiplier: 2× (swing)
- Stop distance: 80 × 2 = 160 pips
- Stop price: 1.0900 + 0.0160 = 1.1060
- Account risk: $200
- Pip value (mini lot, 10,000 units): $1.00/pip
- Position size: $200 ÷ (160 pips × $1.00) = 1.25 mini lots (round to 1 mini lot)
Position-size reference table:
| Input | Formula | Example A | Example B |
|---|---|---|---|
| Stop distance | ATR × multiplier | $4.80 | 160 pips |
| Dollar risk | Account % × equity | $240 | $200 |
| Unit value | $/share or $/pip | $1.00/share | $1.00/pip |
| Position size | Risk ÷ (distance × unit value) | 50 shares | 1.25 mini lots |
These calculations can be easily replicated with a straightforward formula once the inputs are set.
Position sizing: keeping dollar risk flat when ATR changes
The position-size formula is the most important math in this article:
Position size = Risk amount ÷ (Stop distance × unit value)
When ATR expands, stop distance grows. If you don't shrink position size to compensate, your dollar risk per trade balloons. ATR-based stops do not replace position sizing — they define the stop distance, and you must do the sizing math every single time.
Backtesting checklist before committing real capital:
- Define your ATR period, multiplier, and entry rule precisely.
- Run the strategy over at least two different volatility regimes (a trending period and a choppy period).
- Measure win rate, average win, average loss, and max drawdown.
- Include realistic slippage (0.01%–0.05% per side for liquid equities; more for thinly traded instruments) and commissions.
- Check whether the required position size is ever impractically small (below your broker's minimum lot size). If so, either increase account size or skip those trades.
- Forward-test on paper for 20–30 trades before going live. Backtesting metrics like win rate and average win/loss ratio only tell you what worked historically — forward testing tells you whether you can execute the rules under real conditions.
Pro Tip: If your backtested position size frequently falls below one share or one micro lot, your account is too small for that instrument's ATR stop distance at your target risk percentage. Either trade a smaller instrument or accept a higher risk-per-trade percentage temporarily.
Slippage can impact trade outcomes during high volatility when ATR stops widen, so risk calculations should incorporate a buffer for slippage risk.
Common mistakes traders make with ATR stops
Placing stops without reference to structure. An ATR stop placed in the middle of a consolidation range will get hit by normal noise. Always check whether your stop lands near a logical level (below support for longs, above resistance for shorts). If it doesn't, either adjust the multiplier or skip the trade.
Failing to resize when ATR changes. This is the most expensive mistake. A trader who keeps the same share count when ATR doubles has effectively doubled their dollar risk. Wider stops require smaller positions — no exceptions.
Using too-small multipliers on short timeframes. A 1× ATR stop on a 5-minute chart will get hit by routine intraday noise on almost any liquid stock. Scalpers need at least 0.75×–1.0×, and even that requires tight execution.
Applying identical settings across asset classes. Crypto trades with 5%–10% daily ATR ranges need much wider multipliers than large-cap equities with 0.5%–1.5% ranges. Copy-pasting settings from one asset class to another is a fast way to blow stops.
Rules of thumb worth memorizing:
- Start with ATR(14) on your primary entry timeframe.
- Day trades: 1.0×–1.5×; swing trades: 1.5×–2.5×; trend trades: 2.0×–3.0×.
- Recalculate position size every time ATR changes materially (more than 20% from your entry-day reading).
- Never widen a stop after entry to avoid being stopped out. That's not risk management; it's hope.
- Combine ATR distance with a nearby structural level whenever possible.
Brief case example: A swing trader enters a stock at $50 with ATR = $1.00 and places a 2× stop ($2.00 below entry, at $48.00) for 100 shares, risking $200. Two weeks later, ATR expands to $2.50 during an earnings cycle. The trader adds to the position without recalculating. The new effective stop distance is $5.00, and with 200 shares, the dollar risk is now $1,000 — five times the original plan. One bad day wipes out weeks of gains.
Key Takeaways
ATR stops work only when stop distance, multiplier, and position size are calculated together on every trade — not just at entry.
| Point | Details |
|---|---|
| Core formula | Stop = entry ± (ATR × multiplier); use ATR(14) as the default starting period. |
| Multiplier guide | Day trades: 1.0×–1.5×; swing trades: 1.5×–2.5×; trend trades: 2.0×–3.0×. |
| Size to stop | Position size = risk amount ÷ (stop distance × unit value); recalculate when ATR shifts. |
| Chandelier Exit | Anchors to the highest high minus ATR × multiplier; typical settings are 22-period lookback and 3× ATR. |
| Disciplineaiapp | Automates ATR calculations, position-sizing checks, and trade journaling so you apply these rules consistently across every trade. |
ATR stops are a tool, not a trading system
Here's what most guides won't tell you: the multiplier debate is mostly a distraction. Traders spend hours optimizing between 2× and 2.5× when the real problem is that they move their stops after entry, skip the position-size math when they're excited about a setup, or apply the same settings to a crypto trade and a blue-chip equity without thinking.
ATR stops solve a specific problem: they replace arbitrary stop placement with a volatility-calibrated distance. That's genuinely useful. But they don't tell you when to enter, they don't account for liquidity gaps, and they won't save you if you're over-leveraged. The behavioral side of trading — the impulse to widen a stop when you're down, the temptation to skip the sizing math on a "high-conviction" trade — is where most of the damage actually happens.
Rules-based ATR stops help because they remove the decision in the moment. You set the rule before the trade, and you follow it. That's not a small thing. Traders who journal their ATR stop placements and review them after the trade closes learn faster than those who rely on feel. The exit was either within the plan or it wasn't, and the record shows it.
The caution worth repeating: ATR is one input into a system, not the system itself. Combine it with a clear entry signal, a structural reference point, and a position-size rule. Test it across different market regimes before trusting it with real capital. And when the market is choppy and ATR stops are firing constantly, that's the indicator telling you the conditions aren't right for trend-following exits. Volatility-based stops perform worst in directionless markets — that's not a bug, it's a feature you need to plan around.
Disciplineaiapp puts ATR stop rules to work automatically
Calculating ATR stops manually on every trade is straightforward in theory and error-prone in practice. Disciplineaiapp handles the calculation layer automatically, so the math is never the bottleneck.

The platform computes ATR-based stop distances across multiple timeframes, flags when ATR expands beyond your baseline, and prompts position-size adjustments before you place an order. The market replay feature lets you walk through historical volatility regimes and test your multiplier choices against real price action, including gap events and earnings moves, before committing real capital. Every trade is logged automatically with entry, stop distance, ATR reading, and outcome, giving you the data you need to refine your settings over time.
If you want to validate your ATR stop rules with structured backtesting and live execution tracking, explore the full feature set or get started on the app today.
Useful sources for further reading
-
ATR Trailing Stops | StockCharts ChartSchool — Authoritative explanation of ATR trailing stop calculation, including the 21-period default and 3× multiplier used on the StockCharts platform. Used for calculation mechanics and update rules.
-
Optimize Trading Results Using Volatility Stops | Investopedia — Covers multiple volatility stop types (ATR, highest high, swing chart, Gann angle) with clear explanations of when each works and when it fails. Used for regime guidance and comparative context.
-
ATR Stop Loss in Forex | ForexTradeLab — Practical multiplier table by trading style and explicit guidance on position sizing when ATR widens. Used for multiplier ranges and sizing rules throughout.
-
Volatility Stop | TrendsAndBreakouts — Explains ratcheting mechanics, flip behavior, and recommended parameters (20–22 lookback, 2.0–3.0× multiplier). Used for Chandelier Exit and trailing stop sections.
-
Volatility-Based Stops | Positioned Traders' Glossary — Covers backtesting methodology and key metrics (win rate, average win/loss, max drawdown, slippage). Used for the backtesting checklist.
-
Volatility Stop Indicator | Positioned Traders' Glossary — Details Chandelier Exit formula, ratcheting behavior, and why trend followers prefer it. Used for Chandelier Exit section.
-
ATR Trailing Stop Advanced Discussion | Forex-Basics — Practitioner commentary on the ratchet tradeoff and why giving back open profits is the expected cost of trend protection. Used for behavioral perspective.
-
How to Calculate ATR Stop Loss | TradingToBeRich — Step-by-step ATR(14) calculation with worked multiplier examples from 1.0× to 3.0×. Used for calculation section and worked examples.
-
DisciplineAI Blog — Resource hub covering risk management, backtesting, and execution discipline for active traders.