Match your trade frequency to your edge, not your excitement. Fewer, higher-quality setups beat frequent, marginal ones almost every time once you account for commissions, spread, and tax drag. Start a 30-day frequency experiment now: track trades per session, net P&L per trade, and win rate by trade-count band before you adjust your position sizing.
TL;DR:
- Trading more than ten trades per day often results in a profit decline due to increased costs from spreads, slippage, and taxes, without guaranteed gains.
- Measuring trade frequency consistently is challenging because algorithmic splits, partial fills, and paper logs distort counts, so fixing these issues first is crucial.
- Optimizing trade frequency involves running controlled experiments across defined bands while holding other variables steady, with a minimum of 20 to 30 trades per band for reliable results.
- Trade frequency should be aligned with your market's information flow and your strategy's logic, not based on arbitrary targets or boredom-driven impulses.
- Automated tools like Discipline AI help traders track trade counts and execution quality effortlessly, making frequency optimization a repeatable, disciplined process.
Table of Contents
- What Counts As Trade Frequency, and How Do You Measure It?
- How Does Trading More Often Erode Your Returns and Tax Bill?
- How Do You Find Your Optimal Trade Frequency?
- What Does the Research Say About Frequency by Trader Type?
- How Discipline AI Turns Frequency Optimization Into a Repeatable Process
- How Trade Frequency Shapes Portfolio Risk and Volatility
- How Does Trading Frequency Affect Slippage and Market Impact?
- How Do Trading Platforms Change What Frequency Is Even Possible?
- Case Studies: What Optimal Frequency Looks Like Across Markets
- What Traders Consistently Get Wrong About Frequency
- Run Your Own Frequency Experiment With Discipline AI
- Sources
What Counts As Trade Frequency, and How Do You Measure It?
Trade frequency optimization starts with a clean definition: the number of trades you execute in a given window, whether that's trades per day, per week, or per session. The tricky part is counting consistently. A round-trip trade (entry plus exit) is one trade. Legging into a position with three partial fills and scaling out in four pieces is still one trade, not seven, even though your platform log shows more line items.
Frequency bands roughly track trading style:
- Scalpers: often 20 to 100+ trades per day, holding positions for seconds to minutes
- Day traders: typically 1 to 10 trades per day, closing everything before the session ends
- Swing traders: a handful of trades per week, holding for days
- Position traders: a few trades per month, holding for weeks or longer
Measurement gets distorted by three common traps: algorithms that slice one order into dozens of child orders, brokers that report partial fills as separate transactions, and paper-trading logs that don't reflect the slippage and rejected orders you'd see live. Fix the counting method before you draw any conclusion about how frequency affects your results.
How Does Trading More Often Erode Your Returns and Tax Bill?
Every extra trade carries a cost most traders underestimate until they add it up over a month. Commissions are the obvious one, but the bid-ask spread often costs more than the commission itself, especially in less liquid instruments.
That's $5 per trade in spread cost alone. Trade five times a day instead of once, and you've turned $5 of daily drag into $25, which is $500 a month before you've made a single directional call.
Trade frequency has a compounding cost structure that's easy to miss:
- Commissions and spread scale linearly with trade count
- Slippage tends to worsen as you trade faster and with less patience for fills
- Short-term capital gains (positions held under a year) get taxed at ordinary income rates in the U.S., while long-term gains get preferential rates. Frequent trading almost always pushes you into short-term treatment.
- Psychological wear from constant decision-making degrades judgment over a session, not just over a career
Statistic to sit with: aggregated account data shows profitability often declines sharply before roughly ten trades a day, then flattens out. The cost curve isn't gradual. It's front-loaded, which means your worst trades of the day are often somewhere in trades three through nine, not evenly distributed.
Talk to a tax professional about your specific situation. Rules on wash sales, mark-to-market elections, and short-term versus long-term treatment vary by account type and jurisdiction, and this isn't the place to guess.
How Do You Find Your Optimal Trade Frequency?
You can't optimize what you haven't measured, and most traders skip straight to "trade less" or "trade more" without ever building the baseline that would tell them which direction actually helps. Here's a three-step framework that removes the guesswork.
- Define your edge in writing. What market condition, setup, and confirmation signal justifies a trade? If you can't write it down in two sentences, you don't have an edge yet, you have a hunch.
- Set baseline metrics before you change anything. Run your current approach for two to four weeks and record net P&L per trade, P&L per hour of active screen time, win rate, and average cost per trade including spread.
- Run controlled frequency bands. Split your trading into buckets, say 0 to 2 trades, 3 to 6, 7 to 10, and 11 or more per day, keeping the same instruments and roughly similar market conditions across bands. Compare net P&L per trade and per hour across bands, not just total profit, since total profit rewards volume even when quality is falling.
For the experiment to mean anything, hold your instrument set, session times, and position sizing steady while you vary only frequency. Give yourself at least 20 to 30 trades per band before drawing conclusions. Fewer than that and you're reading noise. Set a stopping rule in advance, such as "stop the experiment if any band shows a net loss for two consecutive weeks," so you don't rationalize your way through a losing stretch.
Watch execution quality alongside win rate. A band with a higher win rate but worse average slippage can still lose to a band with a lower win rate and clean fills.
- Decide to lower frequency if net P&L per hour drops as trade count rises within a band.
- Decide to raise frequency only if a higher band shows equal or better net P&L per trade, not just more total trades.
Pro Tip: Track P&L per hour of active screen time, not just per trade. A trader who makes $200 across three trades in one hour is outperforming one who makes $400 across fifteen trades over six hours, even though the second number looks bigger on a monthly statement.
What Does the Research Say About Frequency by Trader Type?
The academic and empirical evidence on trading frequency points in a consistent direction: more trades isn't inherently better or worse, but frequency has to match the reason you're trading in the first place.
- Market-design research on optimal trading frequency shows the right cadence depends on how information arrives. When news and data releases hit on a schedule, aligning your trading times to that rhythm is more efficient than trading continuously. When information arrives unpredictably, a higher frequency can be justified.
- Trend-following research finds that well-designed rules perform similarly across different time horizons. The strategy's logic matters more than the raw trade count, though higher frequency does raise whipsaw risk and trading costs.
- Large-sample account data shows the profitability drop-off is front-loaded, with most of the damage occurring before the tenth trade of the day for many retail approaches.
Practical starting ranges: if you're swing trading, one to five trades a week is a reasonable band to test. If you're day trading a liquid instrument with a mechanical system, five to fifteen a day might be appropriate, but only if your backtests and live results support it. Higher frequency is defensible when your method genuinely requires it, such as a mean-reversion system on a fast-moving asset. It's a mistake when it's driven by boredom or the urge to "do something" between real setups.
How Discipline AI Turns Frequency Optimization Into a Repeatable Process
Running the frequency experiment above by hand, in a spreadsheet, works, but most traders abandon it after a week because the tracking is tedious and easy to skip on a busy day. This is where structured tools close the gap between knowing what to measure and actually measuring it.
Discipline AI tracks trade counts, confidence scores, and execution analytics automatically, alongside behavioral markers like how often you deviate from your stated setup criteria. A typical workflow looks like this:
- Run a 30-day experiment using the platform's automated journaling to log every trade without manual entry
- Review performance banded by trade count, comparing net results across low, medium, and high-frequency days
- Adjust your setup confidence thresholds based on which bands actually performed
- Enable stand-aside protection on days when your behavioral markers signal fatigue or tilt, which removes the temptation to force a trade just to hit a personal quota
The AI trade autopsy feature reviews closed trades against the original setup criteria, which catches the gap between "I thought this was a good trade" and "this actually matched my edge." That distinction is where most overtrading hides.
Pro Tip: If you keep breaking your own frequency rules on high-volatility days, that's a behavioral pattern worth logging separately. It usually means your rules are fine, but your emotional state on those specific days needs its own trigger, like a mandatory 15-minute pause after two losing trades.
How Trade Frequency Shapes Portfolio Risk and Volatility
Trading more often doesn't automatically raise your portfolio's risk profile, but it changes the shape of that risk in ways that are easy to miss. Each additional trade is a fresh exposure event: a new entry price, a new stop level, a new chance for a losing outcome to compound with the last one before your account has time to recover psychologically or financially.
Higher frequency also concentrates risk in time. A trader making two trades a week spreads potential drawdowns across weeks, giving the account (and the trader) room to reset between losses. A trader making twenty trades a day can rack up a full week's worth of losing decisions in a single session, and correlated losses hitting back to back often trigger revenge trading, which compounds the damage further.
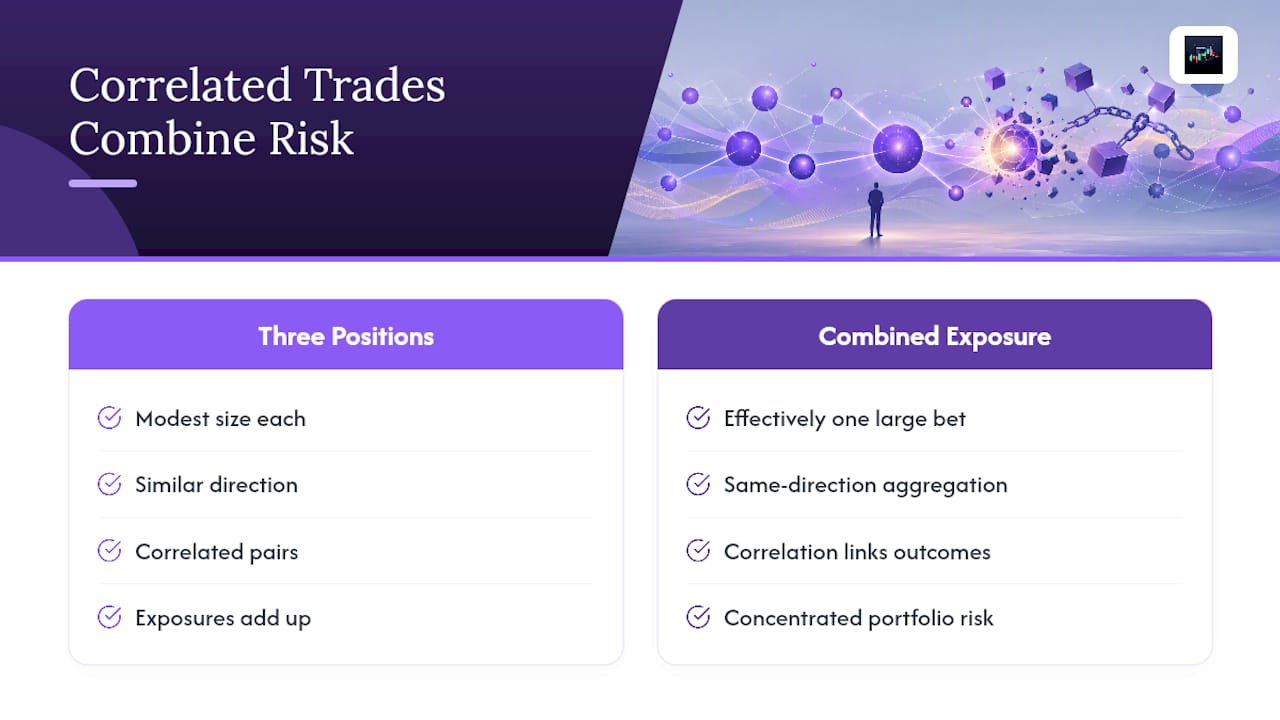
There's a portfolio-level effect too. Frequent trading, especially across correlated instruments, can quietly increase your effective exposure even when position sizes look modest on paper. If you're day trading three correlated crypto pairs and taking similar-direction trades on each, your real risk is closer to one large position than three small independent ones.
Lower frequency, paradoxically, sometimes increases risk per trade because traders holding fewer positions may size up to compensate for fewer opportunities. The fix isn't simply "trade less," it's matching position size and stop placement to whatever frequency you land on, so total risk per day or per week stays inside a range you've deliberately chosen rather than one that emerges by accident from your trade count.
How Does Trading Frequency Affect Slippage and Market Impact?
Every trade you place interacts with the order book, and that interaction has a cost that scales with how often and how urgently you trade. Slippage is the gap between the price you expected and the price you got, and it tends to worsen as trade frequency rises for a simple reason: faster trading usually means less patience for a good fill.
Market impact, the effect your own order has on price, matters more for larger accounts and less liquid instruments, but even retail-sized orders in thin altcoin markets can move the price against you if you're trading frequently and using market orders instead of limits. The faster you cycle through trades, the more often you're crossing the spread instead of waiting for a better price, and that spread cost adds up exactly the way the earlier commission math showed.
Execution quality metrics, like realized spread and slippage versus a fair benchmark price, deserve equal billing with win rate when you're evaluating whether a higher-frequency approach is actually working. This is one of the most overlooked variables in frequency experiments: traders check if they won more or lost more, but rarely check if they got worse fills as their trade count climbed. If slippage rises in step with frequency, that's your answer on whether to scale back, independent of what the raw P&L says.
How Do Trading Platforms Change What Frequency Is Even Possible?
The technology under your trades sets a hard ceiling on how frequently you can realistically trade, regardless of what your strategy calls for. Institutional high-frequency trading operates at sub-second latency using colocated servers and direct market access, a category entirely separate from anything a retail trader is doing, no matter how fast their internet connection is.
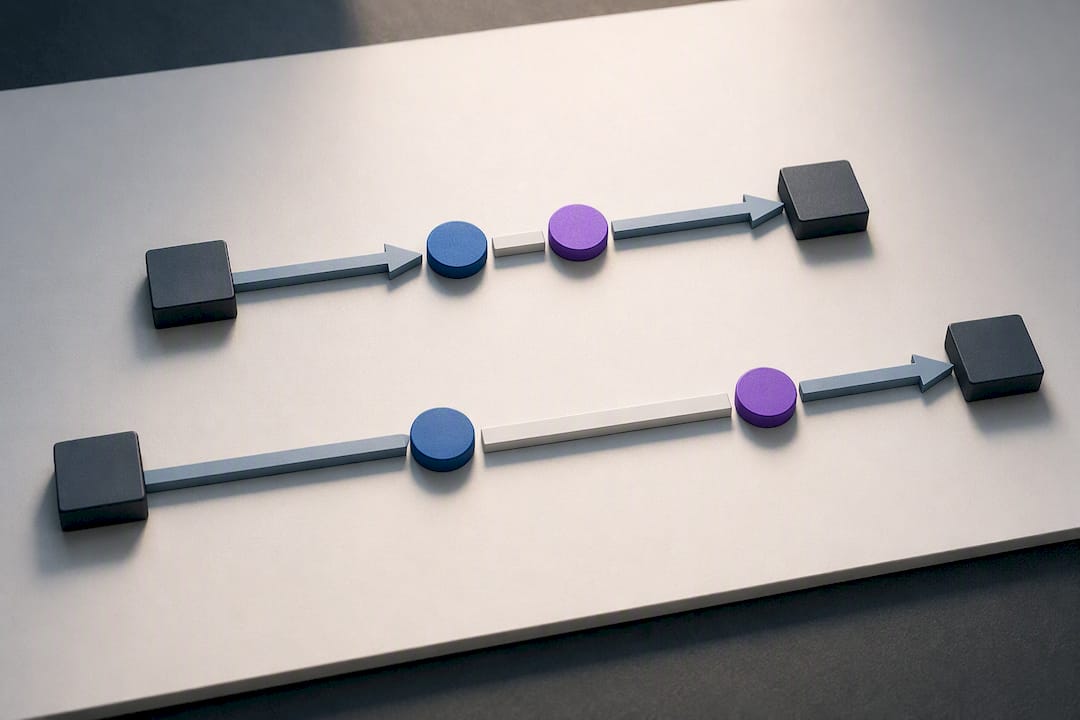
For retail and professional individual traders, the constraints are more mundane but just as real. Mobile app latency, order routing speed, and whether your broker offers direct market access versus a slower retail queue all determine whether a 20-trade-a-day scalping approach is even feasible, or whether you'll be fighting your own execution speed the entire time. A platform with a laggy order ticket makes high-frequency scalping close to impossible regardless of how good your signals are.
On the other end, better analytics and automation have made it easier for lower-frequency traders to be more selective without missing opportunities. Real-time scanning across multiple assets and timeframes means a swing trader checking in twice a day can now catch setups that once required constant screen watching. That's a meaningful shift: the technology that enables high-frequency trading at the institutional level also enables disciplined low-frequency trading at the individual level, by doing the constant scanning so the trader doesn't have to sit through it.
The practical takeaway is to test your platform's actual execution speed and order fill quality before committing to a frequency band that assumes speed you may not have. A strategy backtested assuming instant fills will underperform live if your real-world latency adds even a few hundred milliseconds of slippage per trade.
Case Studies: What Optimal Frequency Looks Like Across Markets
Different markets impose different natural frequency ceilings, and comparing them makes the underlying principle clearer. A swing trader in large-cap equities, working with a market that closes for 16 hours a day and moves on quarterly earnings cycles, has little reason to trade more than a few times a week. The information arrival is scheduled and slow, which lines up with the market-design research on aligning trade timing to information rhythm rather than trading continuously.
Crypto markets behave differently because they trade 24/7 with no closing bell and no scheduled earnings calendar. A trader working Bitcoin or Ethereum might reasonably justify a higher frequency than an equities swing trader, not because crypto rewards more trades by default, but because relevant information (exchange flows, liquidation events, macro headlines) arrives continuously rather than in scheduled bursts. Even here, the account data on profitability dropping off before ten trades a day still applies. Continuous markets don't mean continuous trading is optimal.
Forex sits in between. Major pairs have their own rhythm tied to session overlaps (London, New York, Tokyo), and traders who concentrate their frequency inside those overlap windows tend to report better fills than those spreading trades evenly across a 24-hour day. That's a frequency optimization decision that's really a timing decision wearing a frequency costume: it's not about trading more or less, it's about trading during the hours when spread and liquidity actually favor you.
Across all three markets, the same test applies: does raising your trade count in this specific market and instrument actually raise your net P&L per hour, or just your total activity? The instrument changes. The question doesn't.
What Traders Consistently Get Wrong About Frequency
The biggest mistake I see traders make when they start optimizing frequency is treating the number itself as the goal. They decide "ten trades a day" is the target, then bend their setup criteria to hit it on slow days. That's backwards. The trade count should be an output of your setup quality, not an input you're trying to satisfy.
Short-term overfitting is the second trap. A trader runs a frequency experiment for a week, sees one band perform better, and locks it in permanently, without accounting for the fact that a week of live markets is a tiny, noisy sample.
Build in mechanical safeguards instead of relying on willpower alone: a daily trade cap, a raise-the-bar rule where each subsequent trade needs a stronger signal than the last, and a scheduled weekly review where you actually look at the banded performance data rather than your gut feeling about how the week went.
— Tony
Run Your Own Frequency Experiment With Discipline AI
The framework in this guide works on a spreadsheet, but Discipline AI is built to run it for you automatically. The platform tracks trade counts, confidence scores, and execution quality in real time, so you can see your banded performance (0 to 2 trades, 3 to 6, 7 to 10, and beyond) without manually logging a single entry.

Behavioral coaching flags the sessions where you're deviating from your own setup criteria, and stand-aside protection steps in when your patterns suggest you're about to force a trade just to keep your count up. Combined with automated trade journaling and AI trade autopsies that check each closed position against your original edge, it turns the 30-day experiment from this guide into something you can actually finish instead of abandoning after four days.
Visit the AI Learning Center to get guided tutorials on setting up your first frequency experiment, or explore the broader learning resources to see how the analytics dashboard maps to the metrics covered here. If you're currently tracking trades in a notebook or a basic spreadsheet, pairing that with a structured trading journal is a reasonable first step before moving to full automation.
Sources
- Optimal Trading Frequency for Trend-Following Strategies — Springer
- What is the optimal trading frequency in financial markets? — Du & Zhu (Restud / MIT copy)
- How Many Trades Per Day? What 500K Accounts Show — Hoc-Trade / TradeMedic™
- What is Trade Frequency? Definition, Impact & Optimization — JournalPlus