
That's the number. Move toward 2% only after you've documented a real edge across enough trades to trust it. Fixed-percentage risk keeps a bad week from becoming a blown account, and it lets compounding work in your favor instead of against you. Before you place anything, convert that percent into a dollar figure, mark your stop on the chart, and calculate size from there. Everything else in trading risk management flows from that one decision.
Key Takeaways
Consistent risk per trade, sized from a fixed percentage and a clearly marked stop, is what separates traders who survive losing streaks from those who don't.
| Point | Details |
|---|---|
| Default to 1% risk | Use 1% of current equity as your standard risk per trade until data justifies changing it. |
| Size from the stop, not the entry | Calculate position size only after marking your invalidation point on the chart. |
| Cap portfolio heat | Keep total open risk across correlated positions around 6% to 10% of equity. |
| Cut risk on event days | Drop to 0.5% or skip trading entirely around major releases like NFP or FOMC. |
| Scale only with proof | Raise risk toward 2% only after 100 to 200 documented trades show a controlled drawdown. |
Table of Contents
- What Is Risk Per Trade? Understanding the 0.5%, 1%, and 2% Benchmarks
- The Position-Sizing Formula and a Worked Example
- Choosing Your Percentage: Beginner, Intermediate, or Proven Edge
- Adjusting Risk for Volatility, Asset Class, and Event Days
- Portfolio Heat: Managing Correlated Risk Across Positions
- A Step-by-Step Checklist for Every Trade
- Common Mistakes That Break Your Risk Rules
- How Discipline AI Helps You Apply These Rules Consistently
- Risk-Reward Ratio and Why It Can't Be Separated From Risk Per Trade
- What Consistent Risk Per Trade Does to Your Trading Psychology
- Risk Per Trade Across Day Trading, Swing Trading, and Long-Term Investing
- Backtesting and Optimizing Your Risk Per Trade Settings
- Combining Risk Per Trade With Risk of Ruin Calculations
- Frequently Asked Questions
- Sources
What Is Risk Per Trade? Understanding the 0.5%, 1%, and 2% Benchmarks
Risk per trade is the dollar amount you stand to lose if your stop gets hit, expressed as a percentage of your current account equity. Not your starting balance. Not what you wish you had. What's actually in the account right now.
The industry has settled on a narrow band for good reason. Here's how the common benchmarks break down:
- 0.5% — for brand-new strategies you haven't proven yet, and for traders operating under prop-firm evaluation rules that penalize drawdowns heavily.
- 1% — the standard default for most retail traders with a working strategy and a reasonable track record.
- 1% to 2% — reserved for traders with a documented, proven edge and controlled historical drawdowns.
- Above 3% — generally unsafe for anyone managing their own capital long-term.
The math explains why this range holds up. Same skill, same losing streak, wildly different outcomes.
The Position-Sizing Formula and a Worked Example
Once you know your risk percentage, position sizing is arithmetic, not guesswork. The formula, laid out clearly by Investopedia's guide to determining position size, works like this:
Position size = (Account equity × Risk percent) ÷ Dollar risk per unit
Dollar risk per unit is the distance from your entry to your stop, multiplied by whatever one unit of movement is worth (one share, one contract, one coin).
Here's the process in order:
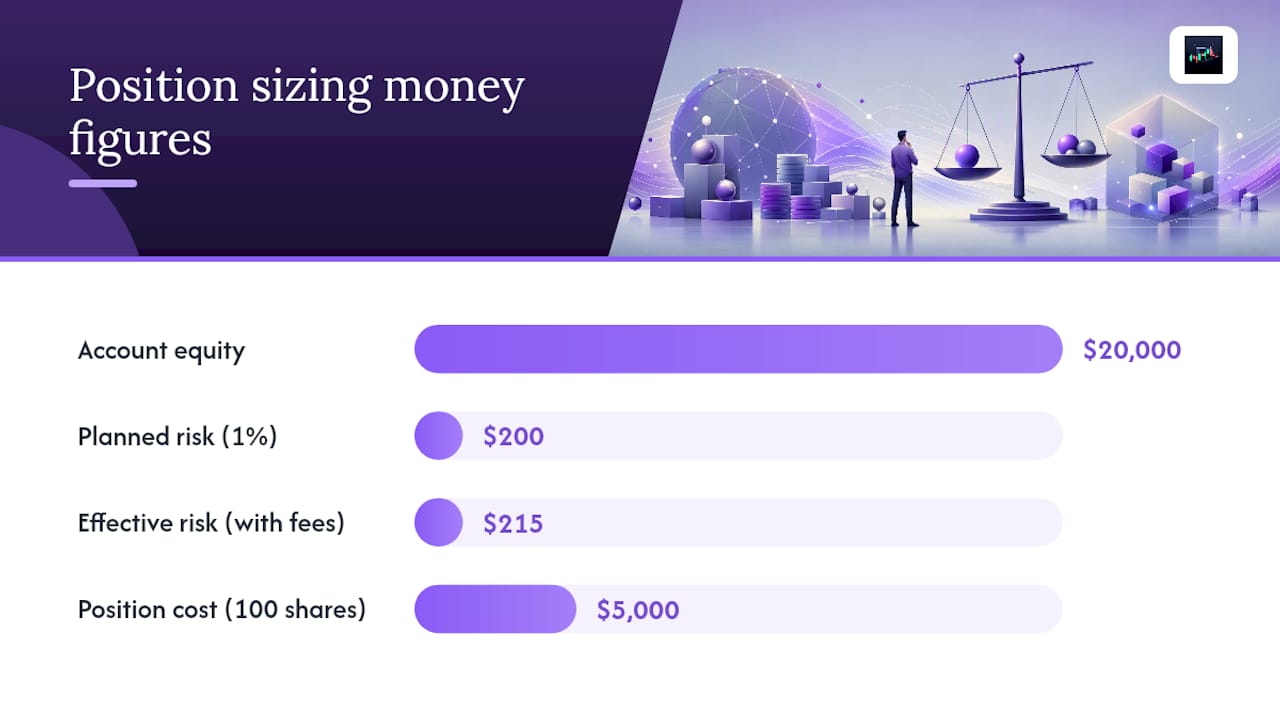
- Determine your account equity. Say it's $20,000.
- Pick your risk percent. At 1%, that's $200 you're willing to lose on this trade.
- Find your entry and stop. Entry at $50, stop at $48. That's a $2 per-share risk.
- Divide dollar risk by per-unit risk: $200 ÷ $2 = 100 shares.
- Check that 100 shares at $50 ($5,000) fits your buying power and leverage limits.
Pro Tip: *Round your position size down, never up.
Fees, slippage, and minimum lot sizes eat into this math in the real world. A $200 planned risk that actually costs $215 once commissions and a few ticks of slippage hit isn't a rounding error if it happens on every trade. Build in a small buffer, especially in fast-moving or thinly traded markets where your fill rarely matches your intended stop price exactly.
Choosing Your Percentage: Beginner, Intermediate, or Proven Edge
That reason is data, not confidence.
- New to a strategy or account: Start at 0.5%. You don't yet know if the edge is real, and prop firms enforcing drawdown limits will disqualify you fast at higher risk.
- Established strategy, decent track record: 1% is your home base. It's aggressive enough to build equity, conservative enough to survive a bad month.
- Documented edge, 100 to 200-plus logged trades, controlled drawdowns: Consider scaling toward 2%, but only incrementally.
This is where the Kelly criterion comes in useful as a mental model, even if you never run the formula. Kelly calculates the mathematically optimal bet size based on your win rate and payoff ratio, but full Kelly is famously brutal, producing swings most humans can't stomach. The formula tells you the theoretical max; discipline tells you to bet less than that.
Adjusting Risk for Volatility, Asset Class, and Event Days
The dollar risk might match, but the probability of getting stopped out by noise, rather than a genuine trend reversal, is much higher on the volatile asset.
Adjust accordingly:
- High-volatility assets (small-cap crypto, low-float stocks): widen stops to respect real structure, then reduce your risk percent so dollar risk stays constant.
- Macro event days (NFP, FOMC, CPI releases): drop to 0.5% or skip trading entirely. Spreads widen and slippage spikes exactly when you least want it to.
- Options and illiquid instruments: factor the bid-ask spread into your per-unit risk calculation. A wide spread on a thinly traded option can silently double your real risk versus what the chart implies.
A quick check with a volatility calculator before entering a new or unfamiliar instrument helps you see whether your stop distance actually matches the asset's normal daily range, rather than a number you picked because it looked clean.
Portfolio Heat: Managing Correlated Risk Across Positions
Risk per trade only tells half the story.
Professional traders typically cap total open portfolio risk, or "heat," around 6% to 10% of equity at any given time. Practical rules that keep you inside that ceiling:
- Count correlated positions as a group, not individually, when calculating total heat.
- Limit yourself to two or three correlated 1% bets open at once, not five or six.
- Reduce per-trade risk to 0.5% when you're already carrying four or more open positions.
- Recheck correlation after major news, since assets that moved independently last month can start moving together fast.
A Step-by-Step Checklist for Every Trade
The order matters more than most traders realize. Setting risk first, before you fall in love with an entry, keeps emotion out of the sizing decision.
- Set your risk percent before looking at the chart in detail: 1% is the default, adjust from there.
- Mark the invalidation point (your stop) based on market structure, not on how much you're comfortable losing.
- Calculate position size using the formula: (equity × risk%) ÷ dollar risk per unit.
- Check practical limits: does this size fit your leverage, minimum lot size, and buying power?
- Execute, and only after the first four steps are locked in.
- Journal immediately: entry, stop, size, reasoning, and outcome once it closes.
Keep a simple loss-limit rule running in the background too: a daily stop (often 2 to 3 times your per-trade risk) and a weekly cap that forces you to stop trading once hit. A daily loss limit framework removes the decision from a moment when you're least equipped to make it well.
Common Mistakes That Break Your Risk Rules
The rules above only work if you actually follow them under pressure, which is where most traders fail.
- Moving your stop after entry because the trade "just needs a bit more room." This is the single most account-destroying habit in trading.
- Increasing size after a loss to "win it back faster." Revenge trading turns one bad trade into two.
- Ignoring slippage and fees in the sizing math, quietly turning a 1% plan into a 1.3% reality.
- Forgetting correlation and stacking five similar bets while believing you're diversified.
The fix isn't willpower. It's automation: a journaling system that logs every rule violation, and hard-coded position-size calculators that remove the temptation to round in your own favor.
How Discipline AI Helps You Apply These Rules Consistently
Knowing the formula and following it under pressure are two different skills. Disciplineaiapp builds the second one into the tool itself: AI-generated trade setups come with suggested stops and confidence scores, so invalidation gets defined before size does, matching the stop-first order this article has walked through. Built-in position-sizing tools calculate your share or contract count directly from account equity and risk percent, removing the manual math where rounding errors creep in. Automated trade journaling and execution-quality scoring flag the exact behavioral traps covered above, moved stops, size creep after losses, before they become a pattern. Explore the feature set or the platform's learning resources for deeper walkthroughs.
Risk-Reward Ratio and Why It Can't Be Separated From Risk Per Trade
Risk per trade tells you how much you can lose. Risk-reward ratio tells you whether that loss is worth risking in the first place. They're two halves of the same decision, and looking at either one alone leads to bad math.
A 2:1 risk-reward ratio means your profit target is twice the distance of your stop.
Here's where traders trip up: a favorable risk-reward ratio doesn't excuse sloppy position sizing. The ratio governs whether the trade is worth taking. The percent governs how much damage a wrong call does. Confusing the two is how traders end up "right on the trade, wrong on the outcome," nursing a great setup that was sized far too aggressively.
The two numbers work together in practice. Match your risk percent to your ratio's demands on your win rate, not to how confident you feel that week.
What Consistent Risk Per Trade Does to Your Trading Psychology
Fixed, small risk per trade changes how a losing trade feels, and that emotional shift compounds into better decisions over time. A $200 loss on a $20,000 account stings for a minute and then you move on. A $2,000 loss on the same account changes how you trade the rest of the day, the rest of the week, sometimes the rest of the month.

This isn't just a comfort issue. Traders sizing too large tend to exit winners early out of fear of giving back gains, and hold losers too long out of hope that the market turns before the stop hits, exactly backward from what a sound strategy requires. Oversized risk doesn't just threaten your account. It actively corrupts your execution of otherwise good setups.
Consistent, small risk builds something harder to quantify: the ability to take the next signal without hesitation. The first one takes the next trade on its own merits. The second one either freezes or overcompensates. Neither reaction has anything to do with whether the next setup is actually good.
Discipline, in the trading sense, is mostly a function of your risk size matching your emotional tolerance for being wrong. Set that number too high, and no amount of willpower or motivational reading fixes the downstream behavior. It becomes data.
Risk Per Trade Across Day Trading, Swing Trading, and Long-Term Investing
Day trading compresses risk decisions into minutes or hours, often with five to twenty trades a day.
Swing trading holds positions for days to weeks, with far fewer trades, often two to ten per month. Stops tend to be wider here because they need to survive normal overnight and weekend volatility, not just intraday noise.
The percent stays constant across styles. What changes dramatically is how that percent translates into capital allocated versus capital risked, which is exactly why the formula, not a flat capital percentage, has to be the starting point every time.
Backtesting and Optimizing Your Risk Per Trade Settings
You don't guess your way to the right risk percentage. You test your way there, using historical data on your specific strategy rather than a generic industry number.
For each setting, calculate the maximum drawdown, the longest losing streak, and the compound annual growth rate the equity curve would have produced. What you're looking for isn't the percentage that maximizes returns. It's the percentage that keeps drawdown inside a level you could actually sit through without abandoning the strategy midway.
Nobody sticks with a strategy through that kind of drawdown in real time, no matter how good the eventual number looks on a spreadsheet. Optimize for a drawdown you could survive emotionally, then check what CAGR that setting actually produces. If it's still attractive at a survivable drawdown, you have a workable number. If it isn't, the strategy's edge probably isn't strong enough to trade at any risk percentage yet.
Retest whenever your strategy's win rate or average risk-reward ratio shifts meaningfully, roughly every 100 to 200 trades. A setting that fit your strategy a year ago may be miscalibrated for how that strategy performs today, especially after market regime changes. A position-sizing walkthrough with concrete examples can help you see how these adjustments play out numerically before you apply them live.
Combining Risk Per Trade With Risk of Ruin Calculations
Risk per trade tells you what one trade can cost you. Risk of ruin tells you the probability that a long enough losing streak wipes out your account entirely, given your win rate, your risk-reward ratio, and your risk percent working together.
The math is unforgiving in a way that surprises most traders. Risk of ruin isn't primarily about whether your edge is real. It's about whether your position sizing lets a real edge survive the variance around it.
This is the calculation that turns "risk per trade" from a rule of thumb into a number you can actually defend with math specific to your own trading results.
A Short Note on Testing Before Scaling
Trade small. Log every entry, exit, and reason. Only raise your risk percent after 100 to 200 trades prove the edge is real, not imagined. That patience is what protects your emotional control when the drawdown eventually comes.
Frequently Asked Questions
What percentage should I risk per trade as a beginner? The lower end protects you while you're still proving whether your strategy actually works.
Neither is universally better. The 1% rule survives losing streaks more comfortably, while 2% can compound faster once you have a proven edge and controlled drawdowns to back it up.
How do I calculate risk per trade in dollars? Multiply your account equity by your chosen risk percent.
Does risk per trade change for crypto versus stocks? The percentage principle stays the same, but crypto's higher typical volatility often calls for wider stops and correspondingly smaller position sizes to keep dollar risk constant.
What's a safe total risk across multiple open trades?
This article is general information, not a substitute for advice from a qualified financial advisor. Consult a qualified financial professional about your own circumstances before acting on anything here.
Sources
- How to determine position size — Investopedia
- How Much Should You Risk on One Trade? — FTMO x OANDA
- What is risk per trade? — The Planet Indicator