
What is trading expectancy and why does it matter more than win rate?
Expectancy in trading is the average amount of money you gain or lose per trade over a large sample. It is the single most honest answer to the question every trader eventually asks: "Is my strategy actually profitable, or am I just getting lucky?"
Most traders fixate on win rate. That fixation is a trap. A strategy that wins 80% of the time can still bleed your account dry if the losses are large enough. Expectancy cuts through that noise by combining both how often you win and how much you win or lose when you do.
Why expectancy deserves your full attention:
- It predicts long-term profitability better than win rate, profit factor, or any single-trade result.
- It shifts your focus from individual outcomes to aggregate performance across hundreds of trades.
- It gives you a concrete dollar figure to work with when sizing positions and setting realistic return targets.
- It exposes strategies that feel good (high win rate, frequent small wins) but are mathematically destined to fail.
- It creates a baseline for measuring whether strategy changes are actually helping.
A positive expectancy means the strategy makes money over time. A negative expectancy means it loses. Zero means you break even before costs, which in practice means you lose after commissions and spreads.
Table of Contents
- The trading expectancy formula, broken down step by step
- How expectancy compares across different trading setups
- How many trades do you need before expectancy means anything?
- How market conditions shift your expectancy
- Profit factor vs expectancy: which one should you focus on?
- Four levers you can pull to improve your trading expectancy
- Why expressing expectancy in R-multiples changes everything
- How AI tools like Disciplineaiapp track and sharpen your expectancy
- Common pitfalls that corrupt your expectancy calculation
- Positive vs negative expectancy across different trading styles
- Why expectancy alone is not enough to evaluate a strategy
- Case studies: how expectancy plays out over different time horizons
- Key Takeaways
- Disciplineaiapp gives you real-time expectancy intelligence
The trading expectancy formula, broken down step by step
The formula is straightforward:
Expectancy = (Win Rate × Average Win) – (Loss Rate × Average Loss)
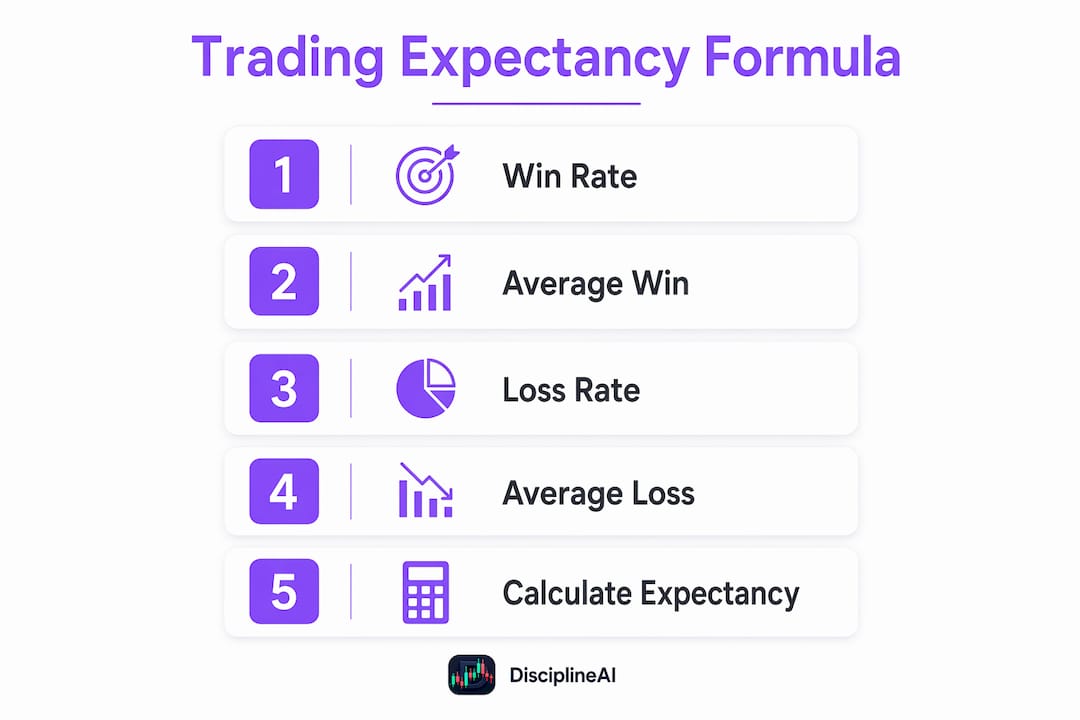
Each component carries equal weight. Win rate is the percentage of trades that close profitably. Average win is the mean dollar gain on those winning trades. Loss rate is simply 1 minus the win rate. Average loss is the mean dollar amount lost on losing trades.
Here is a concrete example. Suppose your recent trades show a win rate around 40%, an average win of about $300, and an average loss near $100:
Expectancy = (0.40 × $300) – (0.60 × $100) = $120 – $60 = +$80 per trade

That figure is what you can expect to earn, on average, every time you execute a trade from this strategy. Run many trades in a year and the expected annual return can be substantial, before costs.
Key points about interpreting the result:
- Positive expectancy confirms a real edge. The strategy makes money over time.
- Negative expectancy means the strategy loses money regardless of how disciplined your execution is.
- Zero expectancy is a break-even result before fees, which becomes a losing result after them.
- Sample size matters enormously. Fewer than 30 trades produces mostly noise. Between 50 and 100 trades a rough idea forms; 200 or more trades offer a more trustworthy result.
Always include transaction costs in your average win and average loss figures. Ignoring commissions and spreads inflates expectancy and creates a false sense of edge.
How expectancy compares across different trading setups
The same formula produces very different results depending on strategy type. The table below shows four common setups with realistic parameters.
| Strategy Type | Win Rate | Avg Win | Avg Loss | Expectancy Per Trade |
|---|---|---|---|---|
| Trend following | 35% | — | — | +$80.00 |
| Mean reversion | — | $120 | — | +$25.50 |
| Breakout trading | — | — | $120 | +$80.00 |
| Scalping | 70% | $40 | $60 | +$10.00 |
The trend-following setup wins less than four times in ten, yet it produces the highest expectancy per trade. The scalping setup wins seven times in ten and generates the lowest. This is the core insight most traders miss: a high win rate is often a misleading indicator of profitability.
Key takeaways by setup type:
- Trend following requires patience and the psychological tolerance to lose frequently, but its math-based edge can reward these traits.
- Mean reversion feels comfortable because wins are common, but the edge per trade is thin and highly sensitive to cost increases.
- Breakout trading sits in a middle ground, with a balanced win rate and solid average win relative to average loss.
- Scalping depends on extremely high trade frequency to generate meaningful returns from a small per-trade edge.
Multiplying expectancy by annual trade frequency reveals the real picture. A trend-following trader with moderate trade frequency at relatively high expectancy earns a solid expected return. A scalper with high frequency and a smaller per-trade expectancy can still yield significant expected returns. The strategy with the lowest per-trade expectancy can outperform in total return simply because of frequency.
How many trades do you need before expectancy means anything?
This is where most traders make their biggest mistake. They calculate expectancy after 15 or 20 trades and treat the result as gospel.
Small samples produce wildly misleading values with high variance. A string of lucky wins inflates expectancy; a rough patch deflates it. Neither tells you much about the underlying strategy.
Best practices for sample size:
- 30 trades minimum before even looking at the number. Below this, variance dominates.
- 50–100 trades to get a rough but usable estimate worth acting on.
- 200+ trades to reach a level of confidence suitable for meaningful strategy decisions.
- 300+ trades if you are making significant capital allocation decisions based on the result.
Randomness is a real factor in short samples. Even a strategy with genuine positive expectancy can produce a negative result over 30 trades. That is not a signal to abandon the strategy; it is a signal that 30 trades is not enough data.
Systematic trade journaling is the practical solution. Every trade logged, including the ones you would rather forget, builds the sample you need to calculate expectancy with confidence.
How market conditions shift your expectancy
Expectancy is not a fixed number. It moves with the market.
Trend-following strategies, for example, can show dramatically different expectancy across regimes. In a strong bull market, the same system that struggles in a choppy range-bound environment may produce significantly higher returns per trade. Market volatility and liquidity both affect how cleanly setups execute and how often stops get hit unnecessarily.
Common ways market conditions alter expectancy:
- Trending markets improve expectancy for momentum and breakout strategies; mean-reversion strategies suffer.
- Range-bound markets favor mean-reversion setups; trend-following expectancy drops sharply.
- High-volatility periods widen spreads and increase slippage, directly reducing expectancy for all strategies.
- Low-liquidity sessions cause worse fills, which erodes average win and inflates average loss.
- Regime shifts (bull to bear, low to high volatility) can turn a positive-expectancy strategy negative almost overnight.
The practical response is to monitor expectancy on a rolling basis rather than relying on a single lifetime average. Rolling windows of 50–100 trades capture recent market friction and reveal whether your edge is holding or eroding. A lifetime average can look healthy while the last 60 trades are quietly losing money.
Adaptive traders treat expectancy as a live signal, not a historical trophy.
Profit factor vs expectancy: which one should you focus on?
Both metrics describe strategy performance, but they answer slightly different questions.
Profit factor is gross profit divided by gross loss. A profit factor of 1.5 means you earn $1.50 for every $1.00 lost. Realistic backtested strategies typically land in the 1.2–2.0 range. Anything above 3.0 in a backtest almost always signals over-optimization or a sample too small to trust.
Expectancy expresses the same underlying information as a per-trade dollar (or R) figure. It directly answers: "What do I expect to make the next time I take this trade?"
Advantages and drawbacks of each:
- Profit factor is easy to compare across strategies at a glance, but it hides trade frequency and individual trade distribution.
- Expectancy is more actionable because it translates directly into projected returns when multiplied by trade count.
- Profit factor can look strong even when expectancy is low, particularly in high-frequency strategies with small average wins.
- Expectancy can be negative even with a profit factor above 1.0 if costs are excluded from the calculation.
The right approach is to use both. Profit factor tells you the shape of the ratio; expectancy tells you the dollar value of running the strategy one more time. Neither alone gives you the full picture, but expectancy is the metric that most directly translates strategy performance into real monetary outcomes.
Four levers you can pull to improve your trading expectancy
Expectancy has exactly four inputs. Improving any one of them moves the number in your favor.
- Raise win rate without hurting risk-reward. Better entry timing, stricter setup filters, and waiting for higher-probability conditions all help. The trap is raising win rate by taking profits too early, which shrinks average win and often makes expectancy worse.
- Let winners run longer. Average win is the most underused lever. Trailing stops, partial profit-taking at extended targets, and resisting the urge to exit early all increase average win without touching win rate.
- Cut average loss with disciplined stops. Predefined stop-loss levels, honored without exception, keep average loss controlled. Moving stops to break even too early can hurt win rate, so the placement requires careful backtesting.
- Filter setups more strictly. Removing low-quality trades from the sample often raises both win rate and average win simultaneously. Fewer trades with higher expectancy beats more trades with lower expectancy.
Pro Tip: Avoid the common mistake of improving win rate by cutting gains short. A strategy that wins 75% of the time but averages $50 per win and $200 per loss has an expectancy of –$12.50 per trade. Chasing win rate at the expense of average win is one of the fastest ways to destroy a strategy's edge.
Over-optimization in backtesting is a real danger here. Expectancy figures above 0.5R per trade often signal curve-fitting to historical data rather than a genuine edge. If your backtest shows extraordinary expectancy, stress-test it with out-of-sample data before trusting it with real capital.
Why expressing expectancy in R-multiples changes everything
R is the amount of money you risk on a single trade, typically set at your stop-loss distance. Expressing expectancy in R rather than dollars removes account size from the equation entirely.
R-Expectancy = (Win Rate × Average Win in R) – (Loss Rate × Average Loss in R)
If you risk $200 per trade and your expectancy formula produces +$60, your R-expectancy is +0.3R. Whether you risk $50 or $5,000 per trade, a +0.3R expectancy means the same thing: you earn 30 cents for every dollar risked.
Practical R-expectancy thresholds for evaluating strategy quality:
- Above 0.5R: Excellent edge. Scrutinize carefully for over-optimization before scaling.
- 0.3R–0.5R: Solid, tradeable edge. Most professional strategies fall here.
- 0.1R–0.3R: Marginal but potentially viable, especially at high frequency.
- Below 0.1R: Thin edge that transaction costs will likely eliminate.
- Negative R: The strategy loses money. No position sizing method fixes this.
Expressing expectancy in R also connects directly to position sizing. The Kelly Criterion uses expectancy to calculate optimal bet size, though full Kelly typically recommends more risk than most traders can stomach. A fixed 1–2% risk per trade remains the safer default regardless of how strong the R-expectancy looks.
How AI tools like Disciplineaiapp track and sharpen your expectancy
Manually calculating rolling expectancy across hundreds of trades is tedious and error-prone. This is where AI-powered platforms change the practical reality for active traders.

Disciplineaiapp calculates rolling expectancy automatically, updating as each trade closes. The platform's confidence scoring system flags setups where historical expectancy is strongest, helping traders allocate attention to the highest-probability opportunities. Behavioral coaching identifies patterns where traders deviate from their own rules, which is one of the most common causes of real-world expectancy falling below backtested levels.
Benefits of AI-assisted expectancy monitoring:
- Bias reduction: Automated journaling removes the temptation to selectively record trades, keeping the sample honest.
- Real-time regime detection: The platform monitors market structure shifts that signal expectancy may be changing.
- Execution quality scoring: Tracks whether fills, timing, and stop placement match the strategy's theoretical parameters.
- Adaptive feedback: Highlights when recent rolling expectancy diverges from the historical baseline, prompting strategy review.
Discipline AI's proprietary intelligence engine continuously learns from market outcomes and evolving conditions. When rolling expectancy drops below a trader's historical baseline, the platform surfaces that signal directly, giving traders the data they need to decide whether to adjust, pause, or stay the course. That kind of real-time feedback is what separates systematic traders from those who only discover a broken edge after significant drawdown.
A trading accountability system built around automated expectancy tracking removes the guesswork from strategy evaluation. The data is there; the platform surfaces it clearly.
Common pitfalls that corrupt your expectancy calculation
Knowing the formula is not enough. These mistakes produce numbers that look meaningful but are not.
Excluding transaction costs is the most common error. Commissions, spreads, and slippage reduce every winning trade and increase every losing trade. A strategy with +$15 gross expectancy per trade can easily go negative once real-world costs are factored in.
Using too small a sample produces expectancy figures that reflect recent luck more than actual edge. Thirty trades feels like a lot when you are in the middle of trading them; statistically, it is close to nothing.
Mixing strategies in one calculation hides what is actually working. If you trade breakouts and mean reversion in the same account, blending them into a single expectancy figure tells you nothing useful about either.
Ignoring regime changes treats a historical average as a permanent truth. A strategy that had +$80 expectancy in 2024's trending market may have near-zero expectancy in a choppy 2026 environment. Lifetime averages obscure this drift.
Cherry-picking the sample period is a subtler version of the same problem. Running the calculation only over your best months produces an expectancy figure that will disappoint you in live trading.
Positive vs negative expectancy across different trading styles
Positive and negative expectancy feel different depending on the strategy, and understanding that difference prevents premature strategy abandonment.
A trend-following trader with a 35% win rate will experience long losing streaks. Fifteen consecutive losses is not unusual. During those stretches, expectancy can look negative over the recent sample even when the underlying strategy is sound. The key is whether the full sample, across enough trades and market conditions, remains positive.
A scalper with a 70% win rate and thin per-trade expectancy faces a different problem. The equity curve looks smooth and encouraging, but a few larger-than-expected losses can erase weeks of small gains. Positive expectancy at the aggregate level can coexist with periods of sharp drawdown.
Mean-reversion traders often see strong expectancy in range-bound markets and sharply negative expectancy when a trend breaks against their positions. For these traders, regime identification is as important as the expectancy calculation itself.
The universal rule: negative expectancy over a sufficient sample (100+ trades) is a strategy problem, not a luck problem. No amount of discipline or position sizing rescues a strategy with genuinely negative expectancy. Positive expectancy over the same sample is worth protecting, even when individual losing streaks make it feel otherwise.
Why expectancy alone is not enough to evaluate a strategy
Expectancy answers one question well: does the strategy make money on average? It does not answer several others that matter just as much.
Drawdown profile is invisible in expectancy. Two strategies with identical +$60 expectancy can have completely different maximum drawdowns. One might draw down 8% before recovering; the other might require a 35% drawdown that most traders cannot psychologically survive.
Trade frequency determines whether expectancy translates into meaningful returns. A strategy with +$200 expectancy that generates six trades per year produces $1,200 in expected annual return. That may not justify the time and capital committed.
Consistency of the edge is not captured. Expectancy assumes future market conditions resemble past ones. Regime shifts can invalidate historical expectancy entirely, and the metric gives no warning until the damage is already visible in the rolling calculation.
Sharpe ratio and Sortino ratio add the dimension expectancy misses: risk-adjusted return. A strategy with high expectancy but low Sharpe delivers positive returns over time but may be too volatile to run at meaningful size. Optimizing on expectancy first, then checking Sharpe, is the right sequence.
Use expectancy as the primary filter. If it is not positive over a sufficient sample, nothing else matters. Once it clears that bar, the other metrics tell you whether you can actually live with the strategy.
Case studies: how expectancy plays out over different time horizons
Short-term (3 months, 60 trades): A breakout trader calculates +$55 expectancy after 60 trades. The number looks strong, but the confidence interval is wide. A single month of adverse conditions could shift the rolling figure to near zero. At this horizon, expectancy is a directional signal, not a definitive verdict.
Medium-term (12 months, 200 trades): The same trader now has 200 trades logged. Expectancy has settled at +$48, slightly lower than the early reading. Transaction costs and a two-month choppy period trimmed the edge. This is a reliable number. The trader can use it for position sizing decisions and set a realistic annual return target.
Long-term (3 years, 600+ trades): Across three years and multiple market regimes, the trader's expectancy shows a clear pattern: strong in trending conditions, weak in range-bound periods. The lifetime average is +$41. More usefully, the regime-specific breakdown reveals that expectancy in trending markets runs near +$75 while range-bound periods produce near +$10. That split informs a regime-filtering rule that improves overall expectancy going forward.
The lesson across all three horizons: expectancy becomes more trustworthy with time and trade count, and the most useful analysis is not the single lifetime figure but the breakdown by market condition, setup type, and time period. Monte Carlo simulation can extend this analysis further, stress-testing expectancy across thousands of hypothetical trade sequences to reveal the realistic range of outcomes.
Key Takeaways
Trading expectancy is the definitive measure of strategy profitability, requiring adequate sample size, honest cost inclusion, and regime-aware interpretation to produce numbers worth acting on.
| Point | Details |
|---|---|
| Expectancy beats win rate | A 40% win rate strategy can outperform an 80% win rate strategy if average wins are large enough relative to losses. |
| Sample size is non-negotiable | Fewer than 50 trades produces unreliable expectancy; 200+ trades is the threshold for confident strategy decisions. |
| R-multiples standardize comparison | Expressing expectancy in R removes account size from the equation, making cross-strategy comparisons valid. |
| Market regime changes the number | Rolling 50–100 trade windows reveal edge erosion that lifetime averages conceal; adapt before the drawdown arrives. |
| Disciplineaiapp automates the process | The platform tracks rolling expectancy, flags regime shifts, and surfaces execution quality data to keep your edge measurable and honest. |
Disciplineaiapp gives you real-time expectancy intelligence
Calculating expectancy manually works until it doesn't. Missed trades, selective journaling, and delayed regime detection all quietly erode the accuracy of the number you are relying on to size positions and evaluate your edge.

Disciplineaiapp was built for traders who want that number to be trustworthy. The platform automatically logs every trade, calculates rolling expectancy across your full history, and flags when recent performance diverges from your baseline. Confidence scoring highlights the setups where your historical edge is strongest. Behavioral coaching identifies the execution patterns that are costing you expectancy in real time, not in a post-mortem three months later.
For crypto, forex, and stock traders who want data-driven clarity rather than gut-feel guesses, Disciplineaiapp turns expectancy from a formula you calculate occasionally into a live signal you act on daily. Explore the AI Learning Center to see how the platform's strategy intelligence tools work in practice, and start building the trade history that makes your expectancy calculation worth trusting.