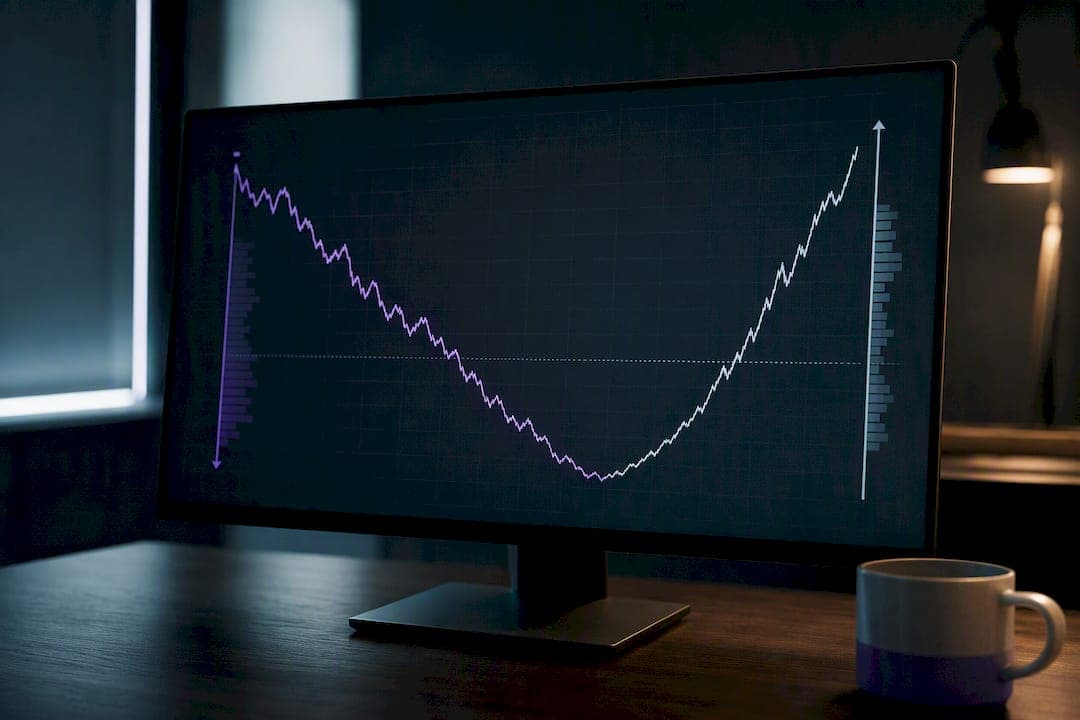
Drawdown analysis measures how far your account has fallen from its highest point, and it is the metric that decides how much you can risk per trade, when to pull the plug, and how long recovery will take. Every serious trading plan runs on three numbers: maximum drawdown (MDD), the Ulcer Index, and a Monte Carlo estimate of what the worst case still looks like. Get those three right and position sizing, stop placement, and kill switches follow almost automatically.
TL;DR:
- Intraday drawdowns can be significantly deeper than closing price calculations, and they are the real trigger for margin calls and forced liquidations.
- Monitoring drawdown duration is crucial, as longer recovery periods increase the psychological strain and risk of abandoning sound strategies.
- Using rolling window analysis helps identify if current drawdowns are normal or signals a strategy breakdown, especially when combined with Ulcer Index scoring.
- Position sizing reduction and pre-defined kill switches are the most effective tools to limit maximum drawdown, especially when scaled down progressively during drawdown thresholds.
- Incorporating Monte Carlo simulations and stress testing provides realistic worst-case drawdown estimates that inform better risk management and position sizing.
Table of Contents
- What Is Drawdown Analysis in Trading?
- Close-to-Close vs. Intraday: Which Drawdown Is Real?
- Recovery Math, Duration, and Why Losses Hurt More Than They Should
- How to Diagnose a Drawdown: Rolling Windows, Ulcer Index, and Attribution
- Position Sizing, Stops, and Kill Switches That Actually Cut Drawdown
- Monte Carlo Simulation and Stress Testing for Drawdown Limits
- How Discipline AI Applies These Diagnostics in Practice
- A Worked Example: From Equity Series to Recovery Plan
- Where I Land on Drawdown Tolerance
- Get Drawdown Diagnostics Built Into Your Trading Workflow
- Sources
- FAQ
What Is Drawdown Analysis in Trading?
Drawdown is the percentage decline from an equity peak to the lowest point reached before a new peak forms. Maximum drawdown (MDD) is the single largest of those declines across your entire track record, and it's calculated as (Trough − Peak) / Peak, expressed as a negative percentage.
Here's how to calculate it from a raw equity series:
- Track running equity after every closed trade or at the end of each bar, depending on your reporting convention.
- Record each new peak as equity rises to a fresh high.
- Calculate the drawdown at every point after a peak: (Current Equity − Peak Equity) / Peak Equity.
- Flag the largest negative value across the whole series. That's your MDD.
- Note the peak and trough dates so you can also measure drawdown duration.
A quick example: your account peaks at $50,000, falls to $38,000, then climbs to a new high of $55,000. The drawdown during that dip is ($38,000 − $50,000) / $50,000 = -24%. If nothing worse happens later, -24% is your MDD. Notice that MDD only tells you the depth of the worst fall, not how often drawdowns happen or how long they lasted, which is exactly why the sections below add duration and frequency on top of it.
Close-to-Close vs. Intraday: Which Drawdown Is Real?
Most backtests report drawdown using closing prices only, but that number can understate your actual risk. Intraday drawdown can run deeper than the close-to-close figure, and it's the number that actually triggers margin calls, prop-firm violations, and forced liquidations, since brokers don't care what your equity looked like at the candle close.
A few conventions worth standardizing before you compare any two strategies:
- Decide whether you're measuring gross equity (before fees) or net equity (after commissions and spread), since the gap widens MDD on high-frequency systems.
- Pick a sampling interval, tick-by-tick, one-minute, or daily, and keep it consistent across every strategy you benchmark.
- Report both close-to-close and intraday MDD when the strategy trades on margin or under a prop firm's daily loss limit.
- Note the currency and account size the drawdown percentage is based on, since a 20% MDD on a $5,000 account behaves very differently than on a $500,000 one.
Mismatched measurement conventions are one of the most common ways traders fool themselves when comparing two systems that look similar on paper but carry very different real-world risk.
Recovery Math, Duration, and Why Losses Hurt More Than They Should
The relationship between loss and recovery is not symmetric, and this is where most new traders get blindsided. A 10% drawdown only needs an 11.1% gain to break even. A 50% drawdown needs a full 100% gain. The formula is straightforward: Required Gain = 1 / (1 − DD) − 1.
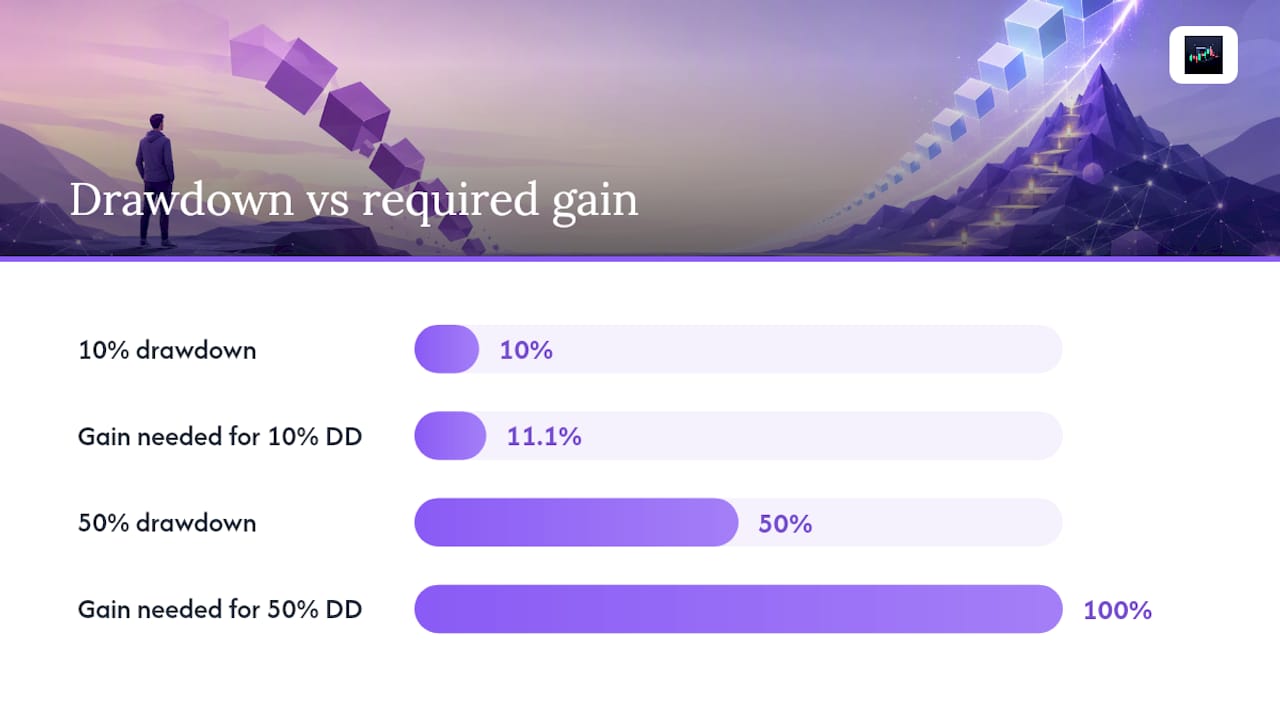
A 50% drawdown erases half your account and demands a 100% return just to get back to even — that gap is the single most important number in risk management, because it shows why avoiding deep drawdowns matters more than chasing bigger wins.
Drawdown duration, the time between the original peak and the point equity finally recovers, matters just as much as depth. Long drawdowns test discipline in ways deep-but-short ones don't. Loss aversion research consistently shows people feel losses roughly twice as intensely as equivalent gains, which is exactly why traders abandon sound systems mid-drawdown and why rule-based exits beat gut decisions when equity is falling.
How to Diagnose a Drawdown: Rolling Windows, Ulcer Index, and Attribution
A single MDD number tells you almost nothing about whether your current drawdown is normal noise or a sign the strategy has broken down. Rolling drawdown analysis fixes that by recalculating maximum drawdown over a sliding window (say, the trailing 60 or 120 trades) so you can see whether drawdown severity is trending worse over time or holding steady.
Three techniques worth building into your routine:
- Rolling and max rolling drawdown: Recompute MDD on a moving window to catch regime shifts before they show up in your all-time stats.
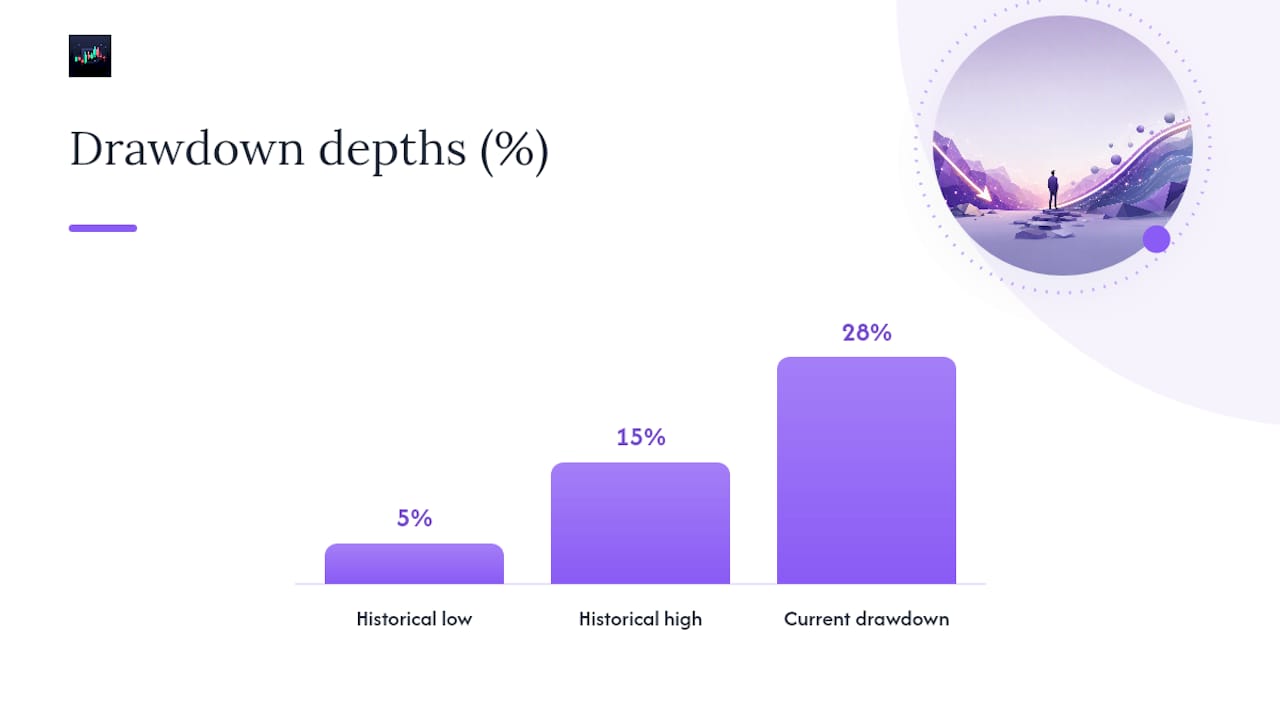
- Drawdown distribution analysis: Build a histogram of every drawdown episode by depth. If your historical drawdowns cluster between 5% and 15% and you're suddenly at 28%, that's a statistical outlier worth investigating, not just enduring.
- Performance attribution: Break P&L down by instrument, hour of day, or signal type. Attribution decomposition frequently reveals that a drawdown is concentrated in one symbol or one trading session rather than spread evenly, which means the fix is a narrow gating rule, not a full strategy rebuild.
The Ulcer Index improves on standard deviation by squaring each percentage drawdown observation, averaging the squares, then taking the square root. That penalizes deep, prolonged drawdowns far more than shallow, brief ones, which standard deviation treats as equally "risky." Dividing return by the Ulcer Index gives you the Martin Ratio, a downside-focused alternative to the Sharpe ratio.
Pro Tip: Run your attribution by hour of day before touching your entry logic. A lot of "broken" strategies are just fine outside a two-hour window where spread widens or liquidity thins out.
Position Sizing, Stops, and Kill Switches That Actually Cut Drawdown
Reducing position size is the single most effective lever for shrinking maximum drawdown, more effective than tweaking entries or exits, because risk-per-trade compounds directly into drawdown depth.
- Size positions with fixed-fractional risk, typically 0.5% to 1% of account equity per trade for retail-scale accounts, and cut that further after two consecutive losses.
- Set stops using ATR multipliers grounded in maximum adverse excursion (MAE) data. Reviewing how far winning trades moved against you before turning profitable typically points toward a 1.5x to 2.5x ATR stop that avoids getting shaken out early.
- Add a volatility or regime filter that pauses new entries when realized volatility spikes past your historical norm, since strategies with MDD under roughly 10% show a much higher likelihood of sustaining positive expectancy than higher-drawdown systems.
- Define a kill-switch threshold in advance, for example a 15% account drawdown, that forces a full stop and review rather than a discretionary "one more trade" decision.
- Scale down in steps, cutting size by half at a warning threshold and to zero at the kill-switch level, instead of an all-or-nothing binary.
Pro Tip: Write your kill-switch number down before you're anywhere near it. Nobody makes a good decision about stopping while they're actually in the drawdown.
Monte Carlo Simulation and Stress Testing for Drawdown Limits
Backtest MDD tells you what happened once. Monte Carlo resampling tells you what could plausibly happen next, which matters far more when you're setting risk limits for live capital. The method reshuffles your historical trade returns thousands of times to build a distribution of possible equity paths, giving you a realistic range of worst-case drawdowns instead of a single historical data point.
Ways to put simulation output to work:
- Run Monte Carlo resampling on your trade log to estimate the 95th-percentile worst drawdown, not just the one your backtest happened to produce.
- Layer in deterministic stress scenarios (a 20% market shock, a liquidity gap, a broker outage) to see how your equity curve holds up outside normal conditions.
- Use VaR and CVaR calculations to estimate one-bar tail risk, but treat the outputs as modeling assumptions, not guarantees, since they depend heavily on the return distribution you feed them.
- Translate the simulation's worst-case percentile directly into your position-sizing formula and pause triggers, so the numbers you trade on come from a distribution, not a single anecdote.
Quantitative risk teams outside trading rely on the same resampling logic to quantify uncertain outcomes before committing resources, and the underlying math translates cleanly to position sizing decisions.
How Discipline AI Applies These Diagnostics in Practice
A serious analytics platform should hand you the full diagnostic stack automatically rather than making you rebuild spreadsheets after every losing streak. Discipline AI's performance analytics generate equity curves, MAE tracking, rolling drawdown snapshots, Ulcer Index scoring, and Monte Carlo recovery estimates as part of standard trade journaling.
Features that map directly to the diagnostics above may include trade autopsies that break down which setups, hours, or instruments are driving a drawdown, behavioral coaching that flags rule violations in real time, stand-aside protection enforcing a pause when predefined thresholds are hit, and automated journaling that keeps a running record usable for Monte Carlo or MAE review.
You can dig deeper into evaluating a trading strategy with real data or work through position sizing examples for crypto and forex for hands-on walkthroughs.
A Worked Example: From Equity Series to Recovery Plan
Take an equity series of $10,000 → $11,200 → $9,600 → $10,800 → $9,100 → $12,000. The peak before the worst dip is $10,800; the trough is $9,100.
- Calculate rolling drawdown on the last 20 trades to confirm whether -15.7% is typical or an outlier for this system.
- Check the Ulcer Index alongside MDD. A high Ulcer Index with a moderate MDD signals a long, grinding drawdown rather than one sharp dip.
- Set the recovery plan: cut position size by 50% until equity closes above $10,800 again, run a Monte Carlo resample on the last 100 trades to confirm the strategy's edge is intact, and only restore full size after two consecutive winning weeks. For a structured version of this, see Discipline AI's drawdown recovery guide.
Where I Land on Drawdown Tolerance
The traders who survive long term aren't the ones who avoid drawdowns, they're the ones who wrote their response down before the drawdown started and followed it anyway. Journaling and Monte Carlo checks beat gut feel every single time; explore Discipline AI's learning resources for more structured workflows.
— Tony
Get Drawdown Diagnostics Built Into Your Trading Workflow
Spreadsheets can calculate MDD after the fact. Discipline AI calculates it, along with rolling drawdown, Ulcer Index, and Monte Carlo recovery estimates, while you're still in the trade, so the kill-switch decision is made by a rule instead of a mood.

Every diagnostic covered here, rolling drawdown windows, MAE-based stop sizing, attribution by hour and instrument, maps to a feature inside the platform's analytics suite. AI trade autopsies show you exactly which setups drove a losing stretch, behavioral coaching enforces your predefined risk rules when a drawdown hits, and stand-aside protection stops you from trading through a threshold you already agreed to respect. Head to the AI Learning Center to see the walkthroughs and start applying these diagnostics to your own trade history today.
Sources
- Understanding Maximum Drawdown (MDD): Key Insights and Formula
- Drawdown in Trading: The Definitive Guide to Measuring and Managing Pain 2026
FAQ
What Is Drawdown Analysis?
Drawdown analysis is the practice of measuring how far account equity falls from a peak, then using that data (maximum drawdown, duration, and recovery math) to size positions, set kill switches, and plan recovery.
What Is Drawdown in Trading?
Drawdown is the percentage decline from an equity peak to the lowest point reached before a new high is set, and it's the core measure of how much pain a strategy can inflict before it pays off.
What Is a Good Drawdown in Trading?
There's no universal number, but backtest evidence links maximum drawdowns under roughly 10% to a meaningfully higher chance of sustainable positive expectancy, while drawdowns past 20 to 30% often signal a strategy or sizing problem.
What Is the 3-5-7 Rule in Trading?
Definitions vary across sources, and no single authoritative version is confirmed here. Treat any specific numeric rule you encounter as a starting framework to test against your own risk tolerance and MDD data, not a fixed law.