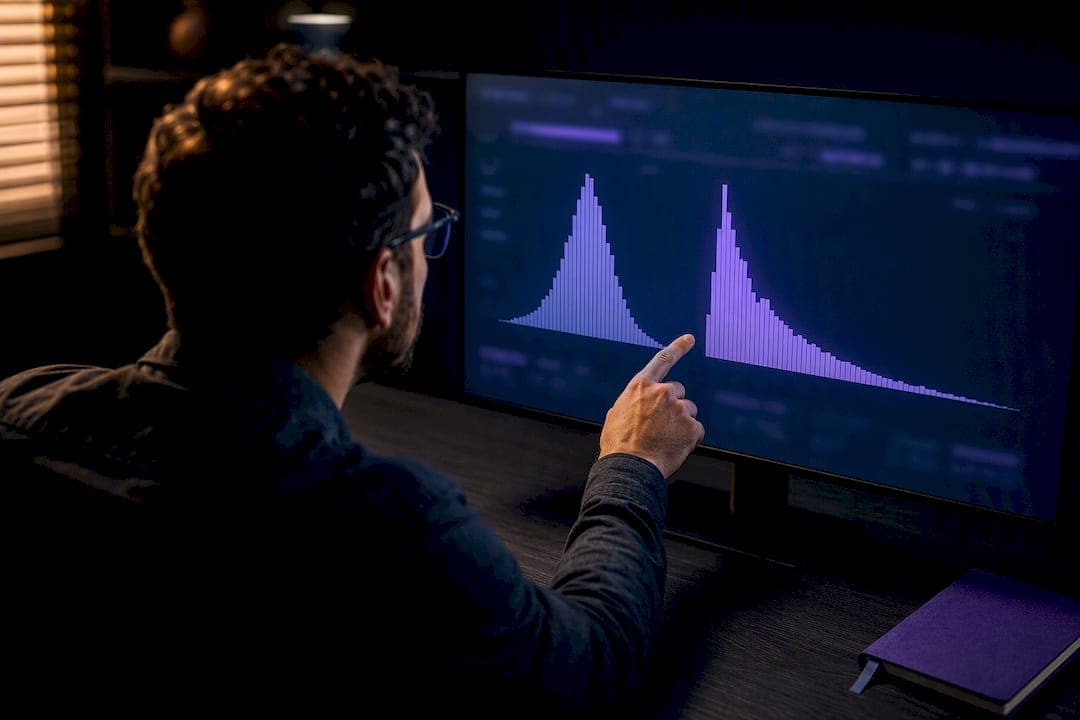
Trade distribution analysis summarizes where trade size and volume cluster in your execution history, exposing concentration risk, tail risk, and hidden execution costs. The immediate move: pull your last several hundred fills, build a histogram with a complementary cumulative distribution function (CCDF), and check high percentile thresholds before you touch a normal-distribution assumption. Methods like the Freedman-Diaconis bin rule and kernel density estimation, plus automated playbooks from advanced trading platforms, turn that raw fill data into sizing and slippage rules you can act on today.
TL;DR:
- Trade sizes often follow heavy-tail distributions, meaning a few large trades dominate volume and require tail-aware budgeting strategies.
- Bin choice and histogram plotting methods significantly affect the visibility of heavy tails, with log-log CCDFs providing clearer tail behavior confirmation.
- Automated and platform-integrated tools can streamline distribution analysis, enabling real-time alerts for shifts in tail dynamics or liquidity conditions.
- Relying solely on normal distribution assumptions risks underestimating tail risk, especially with fewer than 100 to 200 fills, where percentile-based estimates are more reliable.
- Regularly updating trade distribution diagnostics helps distinguish between accumulation and distribution phases, enhancing decision-making in large or illiquid trades.
Table of Contents
- What Trade Distribution Analysis Actually Measures
- Which Statistical Distribution Actually Fits Your Trade Data
- Building Trade-Size Histograms That Actually Reveal Something
- How to Run a Trade Distribution Analysis Step by Step
- Turning Distribution Diagnostics Into Trading Decisions
- How Discipline AI Applies This Analysis to Real Fills
- When Distribution Analysis Actually Pays Off
- Automate the Workflow With Discipline AI
- Sources
- FAQ
What Trade Distribution Analysis Actually Measures
Trade distribution analysis takes your raw execution data, every fill, its size, timestamp, and price, and turns it into a statistical picture of how your trading actually behaves versus how you think it behaves. The goal isn't academic. It answers three practical questions: where is your liquidity concentrated, how exposed are you to execution risk from outsized fills, and what behavioral patterns show up when you look at hundreds of trades instead of the last five.
The standard outputs are:
- Histograms and kernel density estimates (KDEs) showing where trade sizes cluster
- CCDFs that isolate tail behavior, the fills that blow past your typical size
- Summary statistics: mean, median, variance, skew, and kurtosis
Skew and kurtosis matter more here than in most retail trading content, because they tell you whether your fill sizes are lopsided or prone to extreme outliers. Run this analysis after execution reviews, before you finalize order-splitting rules, or as a standing part of a strategy post-mortem. Skipping it means you're sizing positions based on a mental average that heavy tails will eventually break.
Which Statistical Distribution Actually Fits Your Trade Data
Most traders default to assuming their trade sizes and returns are roughly normal. They usually aren't, and that assumption is where sizing models quietly break.
Normal (Gaussian): Low tail risk, symmetric, well-behaved. Convenient for math, rarely accurate for real trade-size data or short-horizon returns. If your fills genuinely fit a normal curve, you're likely trading small, homogeneous size lots in a deep market.
Uniform: Rare in raw trade data. When you see it, it's usually a sign of binned or rounded reporting rather than a real market pattern, and it's worth checking your data pipeline before trusting it.
Power-law / Pareto / heavy-tailed: The common case. Trade sizes and volumes in most liquid markets follow heavy-tail behavior, where a small number of large trades account for a disproportionate share of total volume. This changes everything about how you should size and hedge.
A few quick diagnostic tools separate these cases:
- QQ-plots against a normal reference line to spot deviation visually
- Kolmogorov-Smirnov tests for goodness-of-fit
- Log-log CCDF plots, the standard way to confirm a power-law tail
Statistic to watch: with fewer than a few hundred fills, tail-exponent estimates are unstable. Below that threshold, lean on percentile-based rules (95th/99th) and bootstrap confidence intervals instead of fitting a full tail exponent.
Building Trade-Size Histograms That Actually Reveal Something
Bad binning hides the exact pattern you're trying to find. Before you plot anything, clean your data: pull timestamp, size, price, and fees, deduplicate fills, strip out clearly broken records, and convert everything to notional value if you're comparing across instruments with different contract sizes.
Bin choice matters more than most traders assume:
- Use linear bins when your trade sizes sit in a tight, comparable range
- Switch to logarithmic bins the moment you suspect a heavy tail. Linear bins will bury a power-law tail in a single crowded bar
- Apply the Freedman-Diaconis rule as a starting point for bin width, then adjust by eye
- Overlay a KDE on the histogram to smooth out binning artifacts
- Add a log-log CCDF alongside the histogram, this is what actually confirms tail behavior
- Slice the same chart by time-of-day or venue to see whether concentration shifts intraday
A histogram of trading volumes commonly reveals two distinct patterns: a cloud of small retail-sized trades clustered near the origin, and a sparse scatter of block trades far out on the tail. The first pattern suggests deep, granular liquidity. The second suggests a market where a handful of large participants move price, and where your own large orders will get worse fills than the average would suggest.
Pro Tip: Plot your histogram on both linear and log x-axes side by side. If the two charts tell different stories, you almost certainly have a heavy tail, and the linear chart is lying to you by omission.
How to Run a Trade Distribution Analysis Step by Step
You don't need a research desk to do this properly. A reproducible five-step workflow gets you most of the value:
- Extract and scope. Pull execution data for a defined window, last 60 trading days or your last 200 to 300 fills, whichever gives a stable sample.
- Clean and normalize. Standardize currency, remove duplicate records and clear data errors, and convert to notional value where instruments differ in contract size.
- Bin and visualize. Choose linear or log bins based on your Section 3 diagnosis, then plot histogram, KDE, and CCDF together with the 95th and 99th percentiles, marked directly on the chart.
- Test and quantify. Run a goodness-of-fit test, compute the four moments (mean, median, variance, skew, kurtosis), and record percentile values.
- Set rules and monitor. Translate findings into concrete constraints: size caps, order-splitting thresholds, or venue preferences, then re-run the analysis periodically to catch drift.
Tooling options span a wide range of technical comfort:
- Python with pandas, numpy, scipy, and seaborn or matplotlib for full control
- R for statistically heavy workflows, particularly tail-fitting packages
- Built-in platform analytics, TradeStation's distribution analysis feature plots strategy performance against market criteria like time of day and instrument liquidity
- Automated playbooks from advanced trading platforms for traders who want the workflow run continuously rather than rebuilt from scratch each month
Turning Distribution Diagnostics Into Trading Decisions
A histogram is only useful once it changes a decision. Here's the translation layer that most traders skip.
Heavy tails mean you should expect occasional outsized fills as a normal part of your process, not an anomaly to explain away. Budget slippage using the 95th and 99th percentile fill sizes, not the mean, because the mean systematically understates your real cost exposure when a distribution has a long right tail.
Shifting skew or rising variance across successive time windows is a signal worth watching closely. It often points to directional pressure building or liquidity quietly withdrawing from the order book before price moves.
Practical rules that fall directly out of this analysis:
- Cut immediate fill size when a recent CCDF plot steepens, that's a sign liquidity is thinning
- Split orders more aggressively when a log-log slope confirms a power-law tail
- Treat single outlier fills as data points, not verdicts, until you've seen the pattern repeat
For distinguishing accumulation from distribution in price action, Wyckoff-style structural cues remain genuinely useful when paired with volume diagnostics: look for lateral price ranges with rising volume concentration near resistance, shakeouts, and upthrusts. A heavy-tailed trade-size distribution clustering near a resistance level, combined with those structural signals, is a stronger read than either signal alone.
Pro Tip: Don't judge accumulation versus distribution off a single session. Re-run your volume and price-structure comparison across at least three consecutive ranges before you commit to a directional read.
How Discipline AI Applies This Analysis to Real Fills
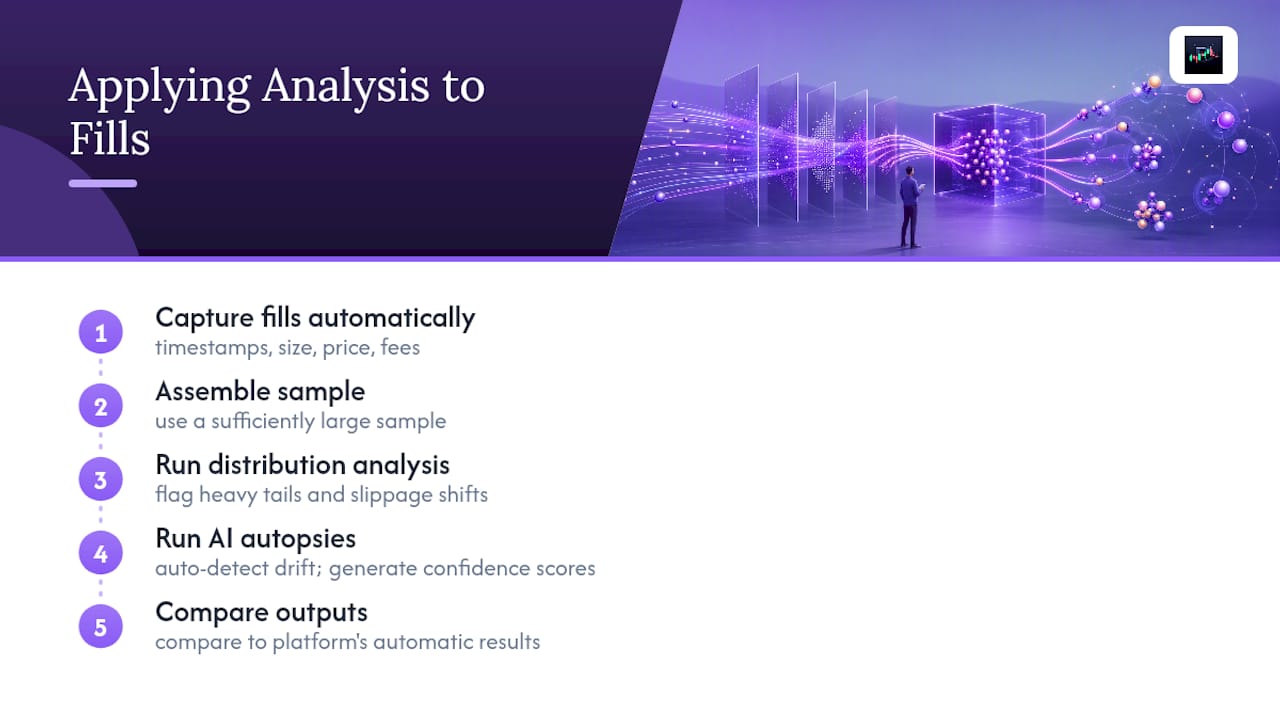
Automated trade journaling can capture the exact fields this kind of analysis needs, timestamp, size, price, and fees, without manual logging. Performance analytics and AI trade autopsies can apply distribution thinking to your own history automatically, flagging when recent fills drift toward heavier tails or when slippage patterns shift.
For traders who want to build the underlying skills first, the slippage analysis playbook walks through percentile-based slippage budgeting in more depth, and the AI trade analysis resource covers how evidence-based confidence scoring builds on these same distribution principles. Start by running the five-step workflow on a sufficiently large sample of fills, then compare the result against what the platform surfaces automatically.
When Distribution Analysis Actually Pays Off
This analysis earns its time on large notional trades, illiquid instruments, or anywhere execution costs meaningfully eat into P&L. Below that threshold, it's a nice-to-have, not a priority.
The recurring mistakes: ignoring intraday structure, applying normal-distribution math to obviously heavy-tailed data, and overreacting to one bad fill instead of waiting for a pattern. My rule of thumb: always report tail percentiles alongside your mean, and don't trust a tail read until you've got at least 100 fills behind it.
— Tony
Automate the Workflow With Discipline AI
Running this analysis by hand every month works until it doesn't, usually right when a market shifts and you need the read most. Some advanced trading platforms address this gap: automated trade journaling captures every fill, slippage analysis playbooks apply percentile-based budgeting automatically, and AI trade autopsies flag distribution shifts before they cost you real money on execution.

If you want the structured version of this workflow with coaching built in, The Disciplined Trader program packages the playbook for $79 as a one-time purchase. For ongoing automated analytics across your full trade history, the Pro plan starts at $8.99 per month. Check the pricing page and pick the option that matches how often you're actually reviewing your fills.
Sources
- Volume distribution analysis
- arXiv preprint on heavy tails / power laws
- Wyckoff distribution primer
- Distribution Analysis (TradeStation help)
FAQ
What Does "Trade Distribution" Mean?
Trade distribution refers to how trade sizes, volumes, or returns are spread across a range of values, rather than clustered around a single typical value. In practice, it usually means checking whether your fills follow a heavy-tailed pattern where a few large trades dominate total volume, versus a more even spread.
What Is Distribution Analysis?
Distribution analysis is the statistical process of summarizing a dataset's shape, its central tendency, spread, skew, and tail behavior, using tools like histograms, KDEs, and CCDFs. In trading, it's applied to fill sizes, volumes, or returns to detect concentration risk and execution cost exposure before they show up as unexplained losses.
What Is the Best Software for Trade Analysis?
The right tool depends on your technical comfort: Python with pandas and scipy gives full statistical control, while platform-native tools like TradeStation's distribution analysis feature offer built-in visualization against market criteria. Discipline AI automates the journaling and slippage-analysis layer of this workflow directly from your trade history, which is worth checking out if you'd rather not rebuild the pipeline manually.
How Do You Know if It's Accumulation or Distribution?
Look for lateral price ranges combined with volume clusters, shakeouts, or upthrusts, the classic Wyckoff structural signals traders use to spot institutional activity. Confirm the read by checking whether the trade-size distribution is shifting toward heavier concentration near resistance (distribution) or support (accumulation) across multiple sessions, not just one.