
Risk of ruin measures the probability that a losing streak wipes out your trading capital before your edge has a chance to compound. Position sizing is the single biggest lever you control: dropping your risk per trade from 10% to 1% or 2% can cut a dangerous risk of ruin down to nearly zero. Practitioners treat under 1% as robust, under 5% as acceptable, and anything above 20% as a sign your sizing will eventually end your account.
TL;DR:
- Reducing risk per trade from 10% to 2% can nearly eliminate the probability of ruin, especially with a strong edge and favorable reward-to-risk ratio.
- A 55% win rate with a 2:1 reward-to-risk setup results in a very low risk of ruin when risking only 1% to 2%, but risk climbs sharply at higher risk levels or lower payoffs.
- The formula’s accuracy diminishes when market conditions change, such as increased volatility, leverage use, or correlated asset moves, which can significantly raise ruin probabilities.
- Monitoring real-time inputs like win rate, reward-to-risk, and correlation is crucial to detect and prevent size drift that increases your actual risk of ruin.
- Long-term investors and swing traders face different ruin risks, with the former being more affected by asset concentration and fundamental failures, rather than trade-by-trade risk.
Table of Contents
- What Risk of Ruin Means and How It Differs From Drawdown
- The Risk of Ruin Formula and What Each Input Means
- Two Worked Examples: Safe Sizing Versus Reckless Sizing
- Reading the Numbers: Benchmarks and Model Limits
- Practical Steps to Lower Risk of Ruin
- Turning Risk of Ruin Into Something You Monitor, Not Just Calculate
- Where the Math Breaks Down
- Volatility and Market Regime: The Hidden Multiplier
- Day Trading, Swing Trading, and Investing Carry Very Different Ruin Profiles
- Beyond Position Sizing: Where Risk of Ruin Meets Broader Risk Management
- Real-World Patterns: How Risk of Ruin Actually Plays Out
- Sizing for Survival First, Optimization Second
- Sources
What Risk of Ruin Means and How It Differs From Drawdown
The concept traces back to gambler's-ruin problems in probability theory, where mathematicians modeled a gambler making repeated small bets against a house edge. Those gambler's-ruin derivations show that even a small statistical disadvantage compounds into near-certain ruin over enough bets, which is exactly why position size matters more than most traders assume.
Drawdown tells you what already happened to your equity curve. Risk of ruin tells you what's likely to happen given your current setup, before you experience it.
That distinction changes when you should actually run the numbers:
- Before increasing position size or leverage on a live account
- Before moving a backtested strategy from paper trading to real capital
- Whenever your win rate or reward-to-risk ratio shifts materially
The Risk of Ruin Formula and What Each Input Means
The most common closed-form approximation for fixed-fractional position sizing is RoR = ((1 − edge) / (1 + edge))^U, where edge and U come from your own trading statistics. For the special case of an even-money bet (1:1 payoff), the formula simplifies to RoR = ((1 − edge) / (1 + edge))^U as well, but edge itself becomes just (win rate minus loss rate).
Here's what feeds the calculation:
- Win rate: the fraction of trades that close profitably, expressed as a decimal
- Reward-to-risk (R): your average win divided by your average loss
- Risk per trade (f): the fraction of capital risked on each position
- Ruin threshold: the capital level you define as unacceptable, often 100% but sometimes 20 to 30%
- Capital units (U): ruin threshold divided by risk per trade, which tells you how many consecutive max losses would ruin you
Edge equals win rate times (1 + R) minus 1. When edge drops to zero or below, the formula returns 100% RoR no matter how careful your sizing looks on paper. That's the formula's way of saying a losing system can't be sized into safety.
Two Worked Examples: Safe Sizing Versus Reckless Sizing
Numbers make this concrete faster than theory does. Both examples below assume the same underlying skill level, a 55% win rate, but they diverge entirely once sizing enters the picture.
-
Example A (conservative): A trader wins 55% of trades with a 2:1 reward-to-risk ratio, risking 2% per trade. Edge = 0.55 × (1 + 2) − 1 = 0.65. With that strong an edge and only 2% at risk, capital units run high and RoR collapses to a fraction of a percent. This is what "sized for survival" looks like.
-
Example B (reckless): Same 55% win rate, but now a 1:1 payoff and 10% risk per trade. Edge = 0.55 × (1 + 1) − 1 = 0.10, a much thinner cushion. Capital units drop sharply because ruin threshold divided by a bigger risk fraction leaves far less room for consecutive losses. RoR climbs into double digits, meaning a realistic losing streak, something like 8 to 10 losses in a row, becomes a live threat rather than a remote one.
The lesson isn't subtle: identical skill, wildly different survival odds, purely because of position size and payoff structure.
Reading the Numbers: Benchmarks and Model Limits
A risk of ruin under 1% is considered robust by institutional standards; under 5% is generally acceptable for retail traders; anything above 20% is a red flag that demands an immediate sizing change, according to practitioner benchmarks widely cited in trading education.
What those bands mean in practice:
- Under 1%: your sizing gives the edge room to play out over hundreds of trades without meaningful blow-up risk
- 1% to 5%: acceptable for most retail accounts, but worth tightening if you're running multiple strategies at once
- Above 20%: you're statistically likely to hit your ruin threshold before your edge proves itself, regardless of how good the strategy looks in backtests
The formula has real limits, though. It assumes trade outcomes are independent, which ignores that a bad week in crypto or forex often means every position in your book is losing at once. It assumes constant edge, when win rates and payoff ratios drift as markets shift regimes. And it ignores fees, slippage, and funding costs, all of which quietly raise your effective risk per trade above what the formula assumes.
Practical Steps to Lower Risk of Ruin
Cutting RoR almost always starts with sizing, not strategy redesign. Reducing risk per trade from 10% to 5% doesn't cut RoR by half; it often cuts it by several multiples, because the exponent in the formula (capital units) grows fast as risk per trade shrinks.
Concrete moves worth making:
- Adopt fixed-fractional sizing and cap risk per trade at 1% to 2% unless your edge is unusually strong and well tested
- Use a fraction of full Kelly sizing (often a quarter to half) rather than the full Kelly criterion, which is mathematically optimal but brutally volatile in practice
- Run Monte Carlo simulations across thousands of equity paths to stress-test correlation, trade sequence, and horizon length, not just the average case
- Cap simultaneous open positions and set a daily loss limit that forces a pause before a bad day becomes a ruinous one
- Reassess your edge (win rate, payoff ratio) before scaling size up, never the reverse
Pro Tip: Decide your ruin threshold before you need it. Most traders quit psychologically long before they hit mathematical ruin, so set the threshold at the drawdown level that would actually make you stop trading, not the theoretical zero.
For payoff-ratio mechanics specifically, reward-to-risk sizing guidance and Kelly sizing for leveraged instruments both go deeper into the tradeoffs between aggressive and conservative fractions.
Turning Risk of Ruin Into Something You Monitor, Not Just Calculate
A static RoR calculation goes stale the moment your win rate or payoff ratio shifts, which is why live monitoring beats a one-time spreadsheet check. Tracking the right inputs continuously turns risk of ruin from a theoretical exercise into an early warning system.
Worth capturing on an ongoing basis:
- Rolling win rate and reward-to-risk over your last 20 to 50 trades, not your entire history
- Realized risk per trade versus intended risk per trade, since slippage and stop-loss gaps quietly widen the gap
- Capital units remaining before your defined ruin threshold
- Correlation between open positions, since crypto pairs often move together in ways independent-trade models miss
Discipline AI approaches this by combining automated trade journaling with confidence scoring and behavioral coaching, so sizing drift gets flagged before it compounds into a real problem. Replay simulation with fog-of-war testing gives traders a way to stress a strategy against unseen sequences, similar in spirit to the Monte Carlo checks described above, without risking live capital while doing it.
Where the Math Breaks Down
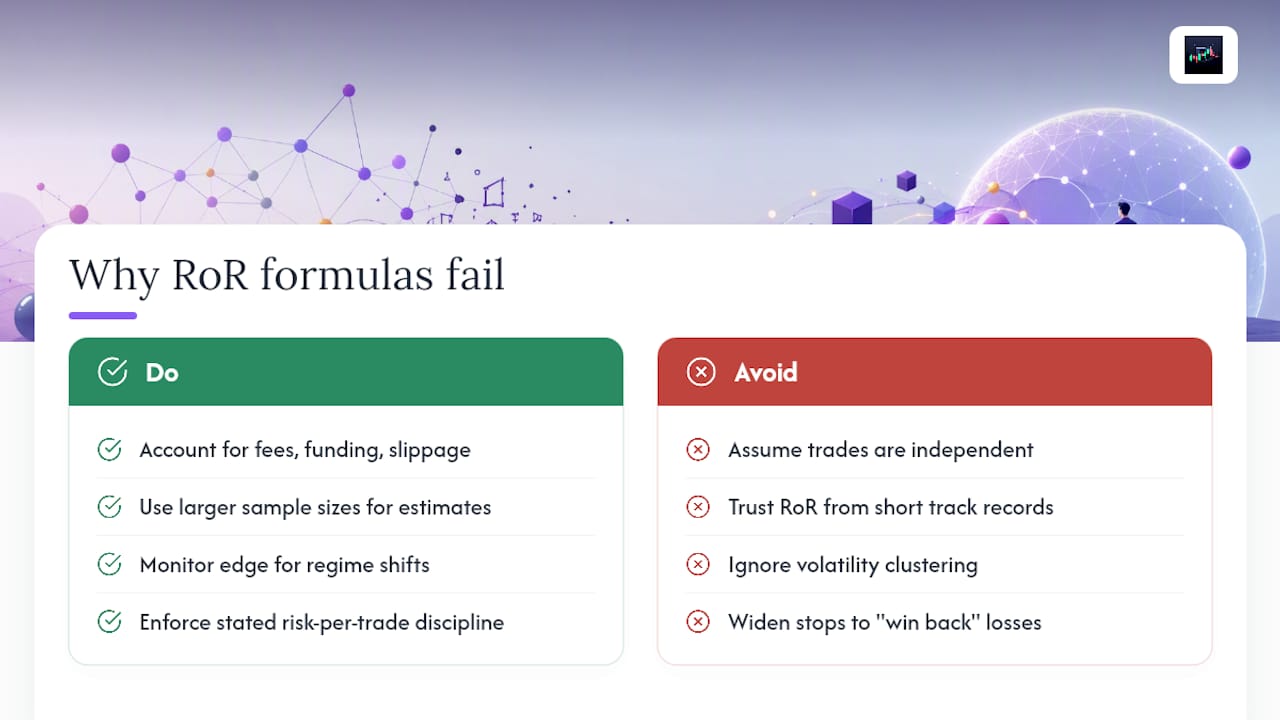
Every risk of ruin formula rests on assumptions that real markets violate on a regular basis. The independence assumption, that each trade's outcome has no bearing on the next, falls apart during volatility clusters, when losing trades tend to bunch together rather than distribute randomly. The constant-edge assumption is arguably worse: a win rate measured over your last 100 trades in a trending market can quietly invert once conditions shift to a chop.
The formula also treats every unit of capital risk the same way, ignoring fees, funding rates on leveraged crypto positions, and slippage on fast-moving pairs. Add those in and your effective risk per trade is almost always higher than the number you plugged into the calculator.
Sample size is another quiet problem. A win rate calculated from 30 trades carries far more statistical noise than one calculated from 300, yet both get plugged into the same formula with equal apparent confidence. Treat any RoR number built on a short track record as a rough estimate, not a guarantee.
Finally, the closed-form formula assumes you'll actually stick to your stated risk per trade on every single trade. In practice, traders widen stops during losing streaks or size up to "win back" a drawdown, both of which quietly move the real RoR far above what the math predicted going in. The formula measures a strategy's mathematical survival odds; it can't measure your discipline in executing that strategy under pressure.
Volatility and Market Regime: The Hidden Multiplier
Risk of ruin isn't a fixed number for a given strategy. It shifts with market conditions, often dramatically, because volatility changes both your win rate and your realistic loss size at the same time. A mean-reversion strategy that shows a comfortable RoR during calm, range-bound markets can see that number spike once volatility expands and price starts trending through stop levels instead of respecting them.
Leverage compounds this problem. Higher leverage means a given percentage move in the underlying asset translates into a much larger percentage move in your account equity, which effectively raises your risk per trade even if your stated risk percentage hasn't changed. That's the effect of leverage on trading risk in practice: it doesn't just amplify gains, it multiplies the speed at which a losing streak reaches your ruin threshold.
Correlated volatility spikes are particularly dangerous for multi-position traders. During sharp market-wide moves, crypto assets that normally trade with modest correlation can suddenly move together, meaning a trader who thought they'd diversified across five positions is effectively holding one large, concentrated bet. Monte Carlo simulations that model this kind of correlation consistently show higher ruin probabilities than independent-trade models, precisely because they capture what happens when everything sells off at once.
The practical takeaway is that RoR calculated during a calm month should never be treated as permanent. Re-running the numbers after a volatility regime shift, or building a volatility buffer into your position sizing during known high-volatility periods (earnings season, major economic releases, thin holiday liquidity), keeps your risk estimate honest.
Day Trading, Swing Trading, and Investing Carry Very Different Ruin Profiles
Trading style changes every input in the risk of ruin formula, which is why a single benchmark doesn't fit all approaches equally well.
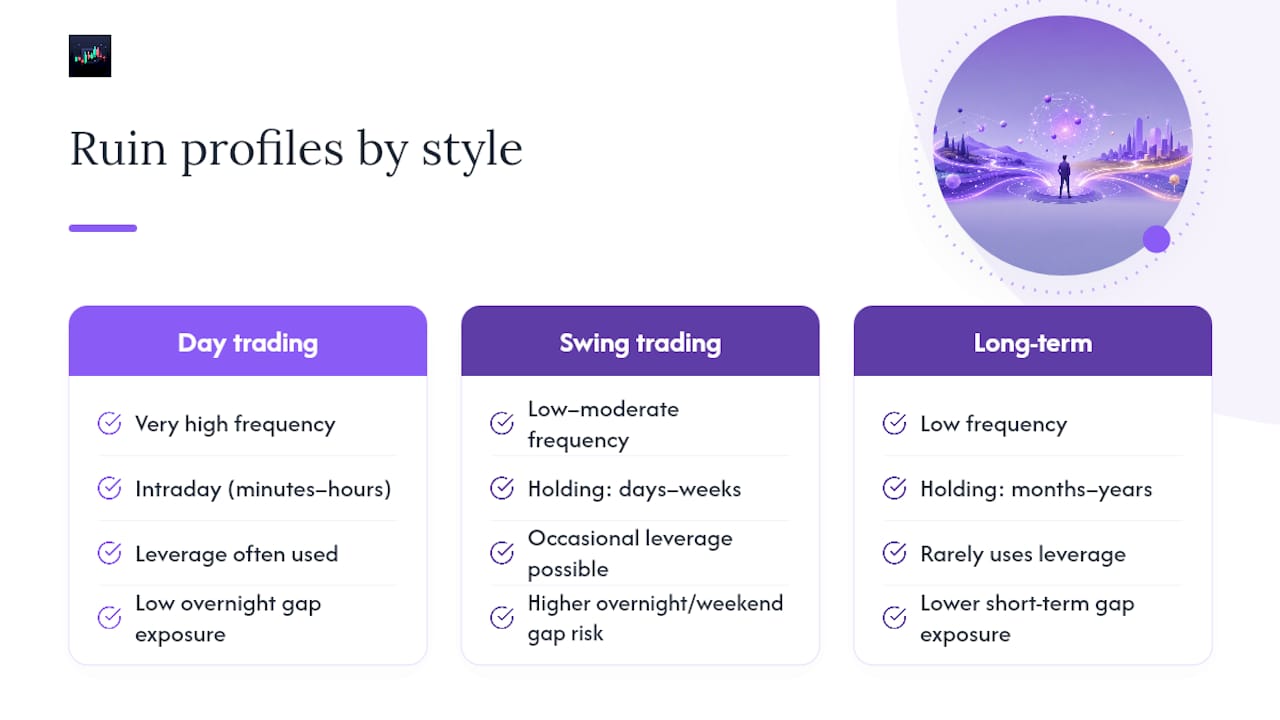
Day traders take the most trades per unit of time, which means their edge, if it's real, compounds fastest, but it also means a flawed strategy reveals its flaws fastest too. High trade frequency with a thin edge and tight, frequently-hit stops can produce a deceptively high RoR even at conservative-looking risk percentages, simply because capital units get consumed quickly when losses cluster within a single volatile session.
Swing traders hold positions for days to weeks, which usually means fewer trades but larger stop distances and more exposure to overnight and weekend gap risk, especially in crypto markets that never close. A swing trader's RoR calculation needs to account for wider average losses per trade, which, all else equal, reduces capital units and raises RoR unless position size is scaled down to compensate.
Long-term investors face a fundamentally different ruin dynamic. With longer holding periods, lower trade frequency, and typically no leverage, the classic fixed-fractional RoR formula becomes less relevant; the bigger risk is concentration in too few assets or a permanent capital loss from a fundamental failure rather than a string of small tactical losses. Diversification and position sizing still matter, but the ruin threshold conversation shifts toward asset allocation rather than per-trade risk percentage.
Beyond Position Sizing: Where Risk of Ruin Meets Broader Risk Management
Position sizing is the dominant lever, but it isn't the only one, and treating RoR as purely a sizing problem misses several other controls that meaningfully affect survival odds. Stop-loss discipline is the most obvious companion: a formula that assumes a fixed average loss per trade only holds if stops are actually honored rather than moved further away during a losing streak.
Diversification and correlation management sit right behind sizing in importance. Capping total simultaneous exposure across correlated assets, rather than just capping risk per individual trade, closes a gap that the basic formula doesn't account for on its own.
Edge verification matters just as much as sizing discipline. A strategy's win rate and reward-to-risk ratio aren't fixed constants; they're statistical estimates that decay or shift as market regimes change. Risk tolerance in trading isn't just a personal comfort question either. It should be calibrated against your actual capital base, time horizon, and how much of your income depends on trading performance, since a professional trading a fraction of their net worth can rationally tolerate a different ruin threshold than someone trading rent money.
Fee and funding-cost awareness rounds out the picture, particularly for leveraged crypto positions where funding rates can quietly erode edge over time even when directional calls are correct.
Real-World Patterns: How Risk of Ruin Actually Plays Out
The clearest real-world pattern shows up in traders who had a genuinely profitable system on paper but blew up anyway. What matters is whether ten losing trades happen to cluster together, which, over a large enough sample, they eventually will.
Leverage-driven account wipeouts in crypto follow a similar script. A trader with a positive edge on directional calls uses high leverage to accelerate returns, and a single sharp adverse move triggers liquidation before the edge has a chance to prove itself over enough trades. The strategy wasn't wrong; the capital units available to absorb variance were too thin to survive the sequence that actually occurred.
The inverse pattern is just as instructive. The strategy didn't improve. The survival math around it did.
That's the pattern worth internalizing: risk of ruin outcomes are rarely about whether a strategy has an edge. They're about whether the sizing behind that edge gives it enough room to actually show up over a realistic number of trades.
Sizing for Survival First, Optimization Second
Most traders spend far more time trying to improve their win rate than they spend adjusting how much they risk per trade, and that's backwards. Win rate and payoff ratio are stubborn. Position size is the one input you can change today, immediately, with zero new skill required, and it moves risk of ruin faster than almost anything else you could work on.
Keep a trade journal, run the numbers periodically, and don't treat a single Monte Carlo output as gospel. Rerun it after any meaningful shift in your win rate, your market's volatility, or the number of correlated positions you're carrying. Survival isn't glamorous, but it's the only precondition that lets an edge actually compound over enough trades to matter. If you want a structured way to keep these inputs in view as you trade, the Discipline AI learning center walks through position sizing, simulation, and risk tracking in more depth.
— Tony