
Liquidity events are short, violent price displacements that happen when clustered stop-loss and liquidation orders get triggered at once, and they hand disciplined traders a repeatable edge. The tactical rule is simple: map where liquidity pools sit before price gets there, wait for the sweep to actually happen, then trade the return move with a defined stop rather than guessing the top or bottom. A platform like Discipline AI can help by scanning multiple timeframes for these setups and scoring your confidence before you risk a dollar.
- Liquidity events are fast, high-volume price moves triggered by stop and liquidation clusters.
- Wait for confirmation of the sweep before entering, never front-run it.
- Define your risk before the trade, not after the wick prints.
Key Takeaways
Liquidity events reward traders who wait for sweep confirmation and size positions by account risk, not by conviction alone.
| Point | Details |
|---|---|
| Map pools before the session | Mark swing highs, lows, and round numbers where stops likely cluster ahead of time. |
| Wait for confirmation, not the wick | A rejection candle or order book reaction matters more than the initial spike. |
| Size by percentage, not dollars | Fixed fractional risk scales with your account instead of staying static. |
| Watch funding and open interest together | A persistent divergence between the two often precedes the next squeeze. |
| Use Discipline AI for cross-asset scanning | Its confidence scoring and autopsy tools help apply these rules consistently under pressure. |
Table of Contents
- What Causes Liquidity Events in Trading
- How Do You Spot a Sweep Versus a Real Breakout?
- A Step-by-Step Entry Framework for Liquidity Events
- Risk Rules That Keep One Bad Sweep From Wrecking Your Account
- What Tools and Data Feeds Actually Matter Here
- Case Study: The August 19, 2026 Liquidation Cascade
- Why Most Traders Get Liquidity Events Backward
- How Discipline AI Helps You Trade Liquidity Events Without Guessing
- Sources
What Causes Liquidity Events in Trading
A liquidity event, in the trading sense, is any burst of forced buying or selling that lets big positions get filled quickly because a pile of orders sits in one place. That's different from the corporate meaning of the term (an IPO or acquisition that lets shareholders cash out), but the mechanism is similar: something forces a large block of holders to act at once.
In markets, this shows up as stop hunts, liquidity sweeps, liquidation cascades, and short squeezes. The mechanics are almost always the same. Resting stop orders convert into market orders once price touches them, and clustered stops near obvious swing highs or lows create a pocket of liquidity that price gets pulled toward. Add leveraged futures positions into the mix, and a break past a level can also trigger margin maintenance failures, forcing exchanges to close positions automatically. That combination, documented extensively in stop-hunting literature, is what turns a normal pullback into a spike.
- Stop hunts: price is nudged into a stop cluster, often on light volume.
- Liquidation cascades: forced closings from leveraged accounts compound the move.
- Short squeezes: crowded short positions get forced to buy back at any price.
One clarification worth making: normal order-flow mechanics aren't the same as illegal manipulation. Market makers and large traders routing orders toward known liquidity is standard behavior, not a crime, though outright spoofing or wash trading crosses a legal line regulators actively police.
How Do You Spot a Sweep Versus a Real Breakout?
Not every spike is the same animal, and treating them identically is how traders get run over twice in one session.
- Stop hunt: A quick wick beyond a prior high or low, usually on a volume spike with no real follow-through, followed by a snap-back within a few candles.
- Liquidity sweep: Similar wick pattern, but often paired with a clear order-book gap getting filled and a spike in exchange liquidation tallies on trackers like CoinGlass.
- Liquidation cascade or short squeeze: A sustained, multi-candle move with rising open interest turning into a sharp drop, plus funding rates flipping hard in one direction.
The tell that separates a fakeout from a genuine trend shift is what happens on the next higher timeframe candle. A wick that gets swallowed by the same candle's close on the 4-hour chart is a different signal than one that closes beyond the level. During the August 2026 crypto liquidation event, roughly 91.6% of the liquidations came from short positions, a lopsided ratio that told anyone watching open interest that the squeeze had a clear direction long before price finished moving.
Statistic to remember: a single lopsided liquidation ratio, heavily skewed to one side, is often a better real-time signal than the price wick itself.
False positives happen constantly on lower timeframes. A five-minute wick means almost nothing in isolation; the same wick on a daily chart, backed by a funding rate flip and rising volume, means considerably more.
A Step-by-Step Entry Framework for Liquidity Events
Trading a sweep well comes down to sequencing, not speed. Chasing the first candle is how most retail accounts get hunted themselves.
- Map the pools first. Mark obvious swing highs, lows, and round numbers where stops likely cluster, before the session even starts.
- Wait for the actual sweep. Don't anticipate it. Let price take out the level and show you a reaction.
- Look for confirmation. A volume spike alone isn't enough. Want a rejection candle, a quick reclaim of the level, or a shift in the order book before committing.
- Choose your side. If the sweep fails to hold and price snaps back, trade the return toward the range. If price closes beyond the level with strength, treat it as trend continuation instead and don't fight it.
On order types, limit orders placed just past the expected sweep zone often get filled at better prices than chasing with a market order mid-spike, but they carry the risk of getting run past if the cascade extends further than expected. Staggering entries in two or three tranches instead of one full-size order softens that risk considerably. And avoid resting your own stop at the obvious swing point everyone else is watching, since that's exactly where the next hunt goes looking. A liquidity sweep trading strategy built around confirmation candles rather than raw wicks tends to filter out a lot of the noise here.
High conviction setups, where funding, open interest, and the order book all point the same direction, deserve full size. When only one signal lines up, treat it as a smaller, probing position or skip it entirely.
Pro Tip: If you find yourself justifying a trade with "it's probably just a sweep," that's usually your subconscious telling you the confirmation isn't actually there yet.
Risk Rules That Keep One Bad Sweep From Wrecking Your Account
Position sizing has to be tied to your account, not to a round dollar number you picked because it felt comfortable. Fixed fractional risk, meaning you risk a set percentage of total equity per trade rather than a flat dollar amount, scales automatically as your account grows or shrinks, which a static stop size never does.
- Risk a consistent percentage of account equity per trade, not a fixed dollar figure.
- Use ATR-based stops when volatility is the main driver of the setup, since they widen automatically during turbulent sessions.
- Use structure-based stops (placed beyond the actual swing point, not right at it) when you're trading a clean technical level.
- Keep a mental stop as backup only if you can genuinely execute it without hesitation. Most traders can't.
Stop placement is a tradeoff either way. ATR multiples adapt to volatility but can leave you exposed longer during a slow bleed. Structure-based stops react faster to invalidation but get hunted more often if placed too tight to the level. Combining sizing discipline with wider or volatility-adjusted stops is one of the more reliable ways to avoid becoming someone else's liquidity.
Before entering, check the order book depth around your entry price. If the spread is wide or depth is thin, expect real slippage, and treat anything beyond a few ticks on a liquid asset as a signal to size down rather than force the trade.

Pro Tip: Never place your stop at the same round number as everyone else's chart pattern says to. If you can see the level on a free chart, so can the algorithms hunting it.
What Tools and Data Feeds Actually Matter Here
Liquidation trackers, the kind aggregated by services like CoinGlass, show real-time liquidation volume by exchange and by side. A sudden spike concentrated on one side is one of the cleanest advance signals you'll get that a cascade is building or already underway.
- Order book / Level 2 data: reveals gaps and thin zones where a sweep can travel fast, plus iceberg orders that hint at hidden institutional interest.
- Funding rate and open interest: a funding rate that stays stubbornly negative while open interest keeps climbing is a textbook setup for a violent short squeeze once a catalyst hits.
- On-chain metrics (for crypto specifically): large exchange inflows or big wallet transfers can precede selling pressure, though on-chain data often lags price by minutes, which matters during fast-moving events.
A curated list of crypto liquidation trackers is worth bookmarking if you trade digital assets regularly, since feed quality and update speed vary a lot between free and paid tools.
Case Study: The August 19, 2026 Liquidation Cascade
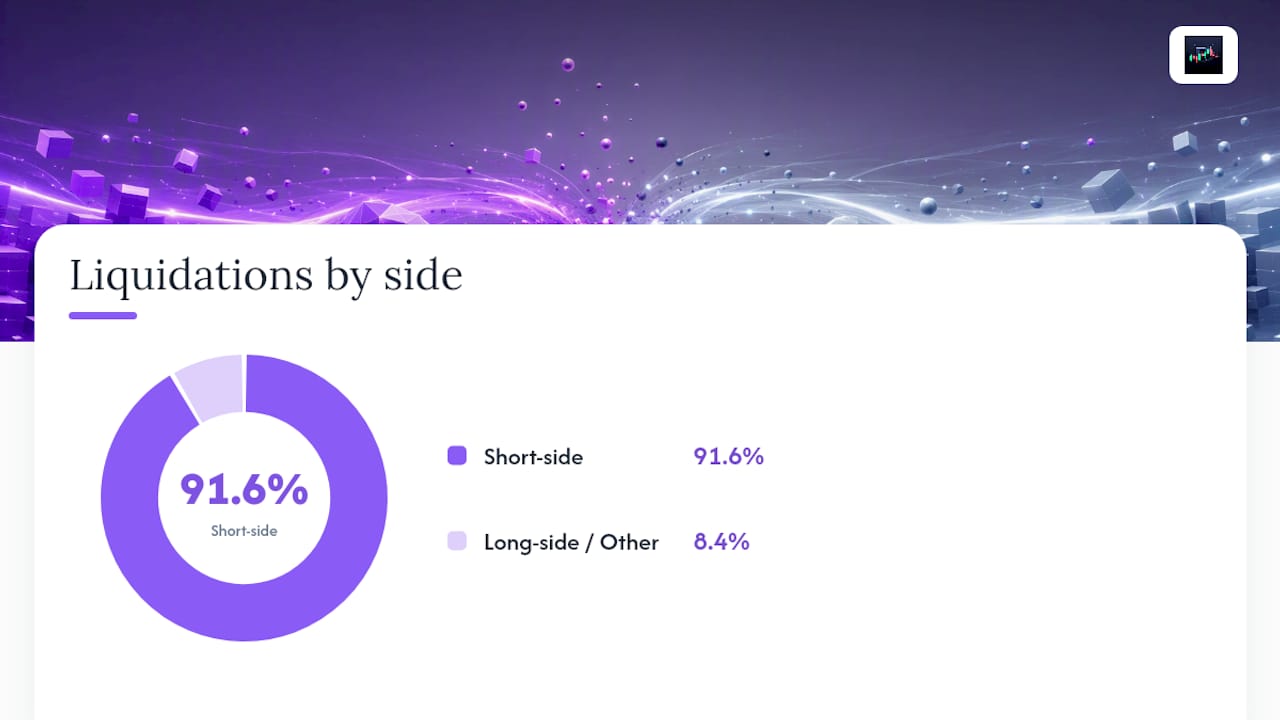
On August 19, 2026, crypto markets logged roughly $2.99 billion in liquidations over 24 hours, the eighth largest single-day total on record. Most of that came from short positions getting forced closed, a squeeze rather than a long wipeout.
The setup had been building for days. Funding rates stayed persistently negative while open interest kept rising, a sign that short positioning was getting crowded even as price refused to fall further. The spark was political: comments tied to Hyperliquid drew a wave of aggressive call buying, and that options flow accelerated the spot move once shorts started covering. Exchange-level factors mattered too. Venues that leaned on auto-deleveraging and insurance fund mechanics absorbed the cascade differently, which changed how much slippage traders actually experienced depending on where they were positioned.
| Metric | Value |
|---|---|
| Total 24-hour liquidations | $2.99 billion |
| Short-side liquidations | about 91.6% |
| Event rank (all-time) | 8th highest single-day total |
| Primary catalyst | Political comments plus options call-buying surge |
The tactical lesson: traders watching the funding and open interest divergence had days of warning that shorts were overcrowded. The entry wasn't at the first violent leg. It was on the confirmed snap-back after volume peaked, sized small given how extended the move already was, with a stop placed beyond the recent swing structure rather than at the obvious round number everyone else was watching.
Why Most Traders Get Liquidity Events Backward
The conventional advice treats every stop hunt like a guaranteed reversal setup, and that's the single most expensive misconception in this corner of trading. A swept level tells you liquidity got consumed. It tells you nothing, by itself, about direction. The August 2026 cascade proved that point at scale: the short liquidations kept compounding well past the point where a contrarian trader "buying the dip on shorts covering" would have already been stopped out twice.
What actually separates traders who profit from liquidity events from those who get chewed up by them is patience around confirmation, not speed. Everyone wants to be the trader who calls the exact wick. Almost nobody has the discipline to wait for the higher timeframe close, the funding rate context, and the order book reaction before committing size. That waiting period is uncomfortable and it costs you the "perfect" entry more often than not, but it's also why fixed fractional sizing and structure-based stops matter more than any indicator combination.
If there's one thing worth prioritizing above all the signal-reading, it's this: build a repeatable checklist and follow it even when the setup feels obvious, because the setups that feel most obvious are usually the ones the crowd already sees too.
— Tony
How Discipline AI Helps You Trade Liquidity Events Without Guessing
Everything above depends on watching multiple signals across multiple timeframes at once, which is exactly where most traders run out of bandwidth during a fast-moving event. Discipline AI scans market structure, funding conditions, and volatility across assets simultaneously, then generates trade setups with a confidence score so you're not manually cross-referencing five charts while a cascade unfolds in real time.

The platform's execution guidance maps directly onto the entry framework covered earlier: it flags when a sweep has confirmation versus when it's still just a wick, and it scores position sizing against your account rather than a generic template. Its stand-aside protection is built for exactly the moment described in the case study above, when a setup looks tempting but the data says wait. After the trade closes, the automated journaling and AI trade autopsy break down whether your entry, sizing, and stop placement actually matched the plan or whether emotion crept in. Explore the AI Learning Center to see how the confidence scoring and autopsy tools apply to your own trading history.
Sources
- Crypto liquidations hit 8th highest of all time on August 19 as $2.99B wiped out — CoinProbe
- Call-buying bonanza around Trump's Hyperliquid comments includes eyebrow-raising trades — CNBC
- Anatomy of crypto’s biggest liquidation event since 2021 — Crypto News Time
- Liquidity event — Investopedia