
Execution quality scoring measures how well your actual fills matched your trading plan, breaking that gap into dimensions like slippage, timing, sizing, and rule compliance so you can find the single behavior costing you the most money. It replaces "that trade felt sloppy" with a number you can track across sessions. Discipline AI automates this scoring for traders who don't want to build spreadsheets to find their weakest link.
TL;DR:
- Average slippage can vary widely, with a median around 0.45 pips and worst-case p95 spikes near 6 pips, highlighting the importance of sample size.
- Independent scoring of six execution dimensions reveals specific weak points, such as timing, discipline, or composure, which composite averages can hide.
- Examining median and p95 outcomes over a rolling window across different segments helps identify consistent issues versus rare outliers.
- Tactical fixes include setting strict order submission rules, choosing appropriate order types, and reducing size on high-slippage trades to improve performance.
- Automated AI platforms streamline data collection and scoring, making ongoing, honest execution measurement sustainable without manual spreadsheet tracking.
Table of Contents
- What Data Do You Need to Score Execution Quality?
- How Do You Score the Six Execution Dimensions?
- What Do Aggregated Execution Scores Reveal Over Time?
- How Do You Fix What Your Execution Score Reveals?
- How Does an AI Platform Automate Execution Scoring?
- What's the Fastest Way to Start Tracking Execution This Week?
- Why Measuring Execution Beats Trusting Your Gut
- Score Your Trades Automatically With Discipline AI
- Sources
What Data Do You Need to Score Execution Quality?
Reliable execution quality scoring starts with four timestamps and prices, not gut feeling. Skip one, and the math falls apart.
You need the decision price (when you decided to trade), the arrival price (when the order actually hit the market), the fill price (or prices, for orders that fill in pieces), and the closing price at some reference point later, which lets you calculate opportunity cost on trades you didn't fully execute.
From those four numbers, two core calculations do most of the work:
- Per-trade slippage: the difference between your expected fill price and what you actually got, expressed in pips, ticks, or percent depending on your asset class.
- Implementation shortfall (IS): the full decomposition of decision-to-fill cost into delay cost, market impact, execution cost, and opportunity cost. This framework, first formalized as implementation shortfall analysis, separates "I hesitated too long" from "the market moved against me" from "I paid the spread."
Not every order type produces a clean number. Pure market orders without a stored reference price should show up as "n/a" rather than a fabricated estimate, and platforms handling slippage measurement treat this honestly rather than guessing.
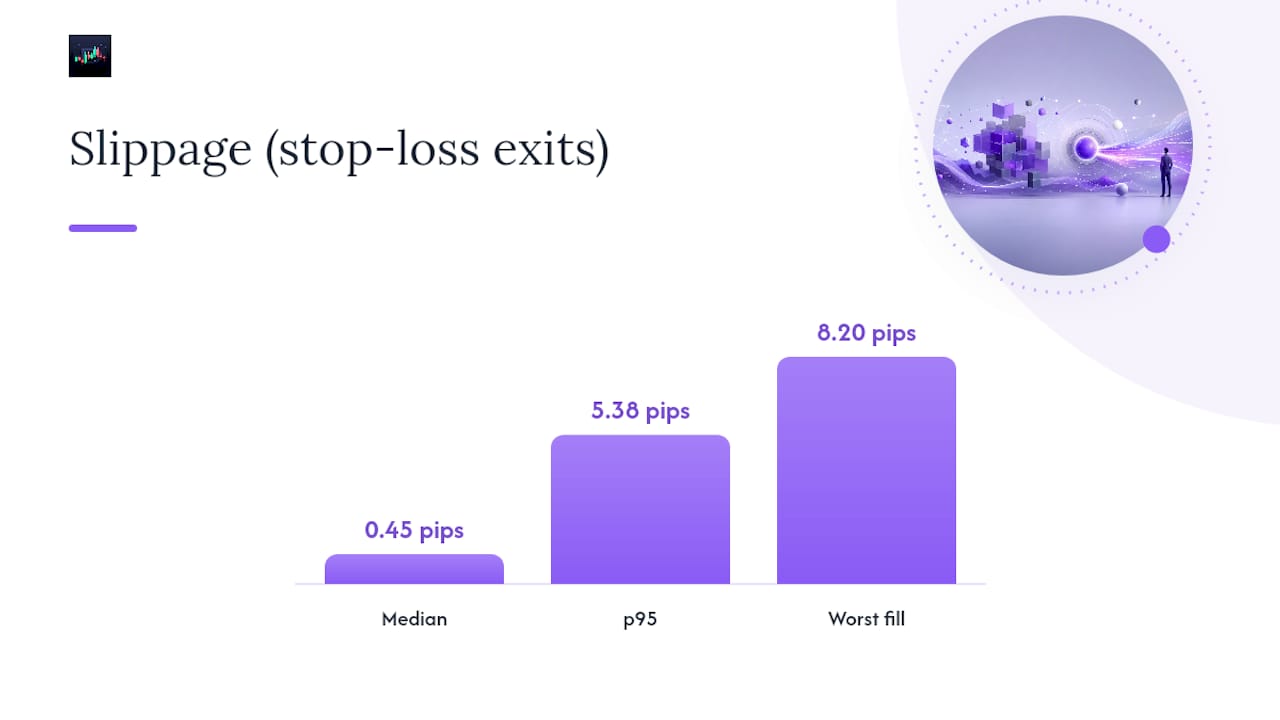
Averages lie here more than almost anywhere else in trading. One slippage measurement approach found stop-loss exits with a median slippage of 0.45 pips but a p95 of 5.38 pips and a single worst fill at 8.20 pips. Report medians and p95 percentiles side by side, and flag any sample under roughly 20 to 30 trades as too thin to trust.
How Do You Score the Six Execution Dimensions?
Slippage tells you what happened to price. It doesn't tell you why. That requires scoring behavior directly, and the traders who improve fastest usually track these dimensions independently rather than lumping everything into one vague "good trade or bad trade" verdict.
A workable scoring model, similar to the six-dimension approach used by execution scoring tools like Mettle's calculator, rates each of these on a 0 to 100 scale per trade:
- Entry timing — did you enter near your planned trigger, or chase price after the move already happened?
- Stop discipline — was your stop placed and honored as planned, or moved mid-trade?
- Exit discipline — did you exit at your target or rule, or freeze and let the trade run past its logical endpoint?
- Sizing — did position size match your risk plan, or did conviction override your rules?
- Rule compliance — did the trade follow your written strategy at all, or was it discretionary improvisation?
- Composure — did you stay calm through the trade, or trade from frustration or fear?
Here's the part most traders get wrong: averaging these six scores hides the one that's actually broken. A trader who scores 95 on everything except a 20 on composure still looks fine on a simple mean. A composite scoring framework using weighted geometric averaging punishes that low outlier instead of burying it, which is closer to how these failures actually behave in live accounts.
What Do Aggregated Execution Scores Reveal Over Time?
A single trade score is a snapshot. The pattern across 50 or 100 trades is where the real diagnosis lives.
Compute per-dimension medians and p95 values across a rolling window, not just a running average. The median tells you your typical behavior. The p95, the worst 5% of outcomes, tells you your tail risk, and tail risk is usually where most of your account damage actually happens. A trader with a median slippage of 0.5 pips but a p95 of 6 pips isn't consistently bad. They're consistently fine until something breaks badly, and that pattern needs its own fix.
Segment the aggregates instead of treating your trading as one undifferentiated blob:
- By symbol liquidity (a major forex pair behaves nothing like a thinly traded altcoin).
- By order type (market orders versus limit orders versus stops).
- By time of day (execution during low-liquidity overnight sessions often degrades measurably).
- By strategy (a breakout system and a mean-reversion system will show different weak dimensions).
Statistic to watch: stop-loss exits in one documented slippage analysis showed a median of 0.45 pips but a p95 spike to 5.38 pips, a tenfold gap between typical and worst-case cost on the exact same order type.
Sample size matters more than most traders assume. A segment with fewer than 15 to 20 trades should carry a low-confidence flag rather than drive a strategy change. Reacting to five bad fills in a thin sample is how traders overcorrect a problem that barely exists.
How Do You Fix What Your Execution Score Reveals?
A diagnosis without a fix is trivia. Match the pattern in your data to a specific tactical change, not a vague resolution to "be more disciplined."
- Delay-dominant slippage (you hesitate, then the market has already moved). Set a hard rule to submit orders within a fixed number of seconds of your signal, or use a pre-set limit order instead of deciding in the moment.
- Spread-dominant cost (you're consistently paying the full bid-ask spread) — switch to midpoint or marketable limit orders where your platform supports them instead of always crossing the spread with a market order.
- Chase-dominant slippage (you keep re-entering at worse prices trying to catch a moving market) — accept a marketable limit at your original price or widen your time-in-force instead of repeatedly adjusting orders upward or downward.
- Slippage asymmetry (your losses slip worse than your wins, a pattern average slippage numbers hide entirely) — reduce size on your highest-conviction trades or reroute those specific order types, since managing execution risk for retail traders means treating this asymmetry as its own diagnosis rather than noise.
Order type selection should follow the same evidence. Use limit orders when price precision matters more than certainty of fill. Use marketable limits or IOC (immediate-or-cancel) orders when you need speed but still want a price ceiling. Reserve pure market orders for genuinely time-critical exits, and split large positions into smaller child orders when trading less liquid symbols to avoid moving the market against yourself.
Behavioral controls close the loop, and platforms like TradeAiFi™ — AI Trading Platform for Stocks, Options & Futures help automate execution and behavioral scoring to reinforce disciplined trading. Fixed position sizing rules that don't flex with recent wins or losses, a hard session max-loss limit, and structured trade journaling prompts after every session all reduce the emotional drift that shows up as composure and sizing damage in your scores.
Pro Tip: Review your execution autopsy the same day you take the loss, not a week later. Memory of exactly why you hesitated or chased fades fast, and a stale review usually produces a generic lesson instead of the specific fix you actually need.
How Does an AI Platform Automate Execution Scoring?
Manually logging four timestamps per trade across dozens of positions a week is exactly the kind of tedious, error-prone work that pushes most retail traders to abandon execution tracking within a month. Automation is what makes the discipline sustainable.

An AI-driven workflow typically handles this by syncing fill data and timestamps directly from your broker or exchange connection, computing the decision-to-arrival-to-fill decomposition automatically, tagging each order by type, and rolling everything into medians and p95 percentiles across the segments that matter to you.
Discipline AI builds this directly into its platform:
- AI-generated confidence scores on trade setups, paired with execution scoring once the trade closes.
- Automated trade journaling that captures the data points execution scoring depends on, without manual entry.
- AI trade autopsies that break down what happened dimension by dimension after a losing or underperforming trade.
- Behavioral coaching that adapts based on which dimension keeps showing up as your weakest.
The traders who stick with execution tracking longest aren't the ones with the fanciest spreadsheet. They're the ones for whom the tracking happens automatically, so the only work left is deciding what to do with what the numbers show.
Transparency matters here as much as the automation itself. A platform that quietly hides small sample sizes or reports a single blended average is giving you false confidence. Percentile reporting and honest sample-size flags, the same standards discussed in depth around AI-powered execution analysis, separate a genuinely useful score from a vanity metric.
What's the Fastest Way to Start Tracking Execution This Week?
You don't need a perfect system on day one. You need a working one.
- Export your last 30 to 50 trades from your broker or exchange statement, in CSV format if available, and confirm it includes timestamps for order submission and each fill.
- Calculate slippage and a rough implementation shortfall for each trade before worrying about the six behavioral dimensions.
- Wait until you have at least 20 trades in a segment before trusting its median, and treat anything under that as directional only.
- Every week, check your worst-p95 dimension and your median slippage by order type, then pick one tactical change from the diagnosis-to-fix list to test for the following week.
- Log the specific rule you're testing, not just "trade better," so next week's review has something concrete to check against.
Pro Tip: After two losing trades in a row, cap your next position size at half your normal risk for the rest of the session. Revenge-sizing after a loss is one of the fastest ways to turn a bad execution score into a genuinely bad week.
Why Measuring Execution Beats Trusting Your Gut
Most traders think they know their weak spot. They usually don't, or they're wrong about the magnitude. I've seen the same pattern come up constantly in execution data: the dimension a trader assumes is fine (usually sizing or composure) turns out to be the one dragging everything else down.
Treat scoring as instrumentation, not a report card. The number exists to point you at the next fix, nothing more.
— Tony
Score Your Trades Automatically With Discipline AI
Building your own spreadsheet to track decision prices, fills, and six behavioral dimensions across every trade works until you have more than a handful of positions a week. Discipline AI is built specifically for traders who want that scoring done automatically instead of manually.

The platform syncs your trade history, computes per-trade slippage and implementation shortfall, scores each execution dimension, and surfaces your weakest one through automated trade autopsies and adaptive behavioral coaching. You get the median and percentile view this article recommends, without building it by hand. If you're ready to see where your own execution is leaking money, visit the Discipline AI learning center to see how the scoring and coaching workflow fits your trading.
Sources
The metric definitions and aggregation guidance in this piece draw from a small set of practitioner sources: a slippage measurement methodology for median and p95 reporting, an implementation shortfall framework for decision-to-fill decomposition, a six-dimension scoring tool, a retail execution risk framework, and an open-source composite scoring model for weighted geometric aggregation.
- How Much Is Slippage Really Costing Your Trading Strategy? | PortQuant
- Measuring Slippage and Implementation Shortfall
- Execution Quality Calculator — Score Your Execution | Mettle
- Quantifying and Managing Execution Risk – Trading Risk Lab
- Retail Forex Brokers Don't Publish Execution Data — So I Open-Sourced a Way to Measure It - DEV Community