
Trade earnings the same way every time: measure the expected move against implied volatility, then sell defined-risk premium when IV Rank and volatility risk premium (VRP) say premium is rich, and buy volatility only when the expected move looks genuinely cheap against realized history. Iron condors and credit spreads carry the seller's edge; long straddles and strangles are the buyer's tool, sized small. Skip undefined-risk trades and thin order books entirely.
TL;DR:
- Selling premium is optimal when implied volatility rank is high (above 50) and the volatility risk premium z-score indicates overpricing.
- Iron condors and credit spreads are preferred for sellers, with strikes set around 10 to 15 delta to control risk and maximize the edge.
- Long straddles or strangles should only be used when the expected move is genuinely cheap compared to the stock's historical post-earnings behavior.
- Liquidity concerns, such as narrow bid-ask spreads and sufficient open interest, are critical to avoid poor execution and hidden costs.
- Macro events and sector-wide reactions can inflate implied volatility, so sector context and seasonality should inform trade timing and sizing decisions.
Table of Contents
- What Earnings Volatility Trading Actually Measures
- Key Metrics to Check Before Placing an Earnings Trade
- Matching Signals to Structures: The Strategy Playbook
- Timing, Strikes, and Order Execution That Don't Wreck the Trade
- Sizing Rules That Keep You in the Game Across Many Quarters
- Trading the Aftermath: PEAD and Gap Setups
- How Discipline AI Reads Earnings Volatility Signals
- Risk Strategies Beyond Simple Position Sizing
- Seasonal Patterns in Earnings Volatility Worth Tracking
- How Macro Conditions and Sector Trends Shift Earnings Volatility
- Fitting Earnings Trades Into a Broader Portfolio
- Reading Implied Skew and Term Structure Around Earnings
- Platforms and Tools for Tracking Earnings Volatility in Real Time
- What Most Traders Get Wrong About Earnings Trades
- How Discipline AI Helps You Run This Playbook
- Sources
What Earnings Volatility Trading Actually Measures
Implied volatility climbs into an earnings print because the options market prices in a single, unresolved event: the number itself. That uncertainty is variance, and variance adds up. Once the report drops, the event resolves, the variance tied to it evaporates, and front-expiry IV collapses almost instantly. Traders call this IV crush.
The ramp usually builds over the final 10 trading days before the print, then steepens hard in the last two or three sessions as gamma-sensitive market makers adjust. The ATM straddle price functions as the market's own forecast of the expected move, and IV crush after the report can wipe out 40% to 70% of that straddle's value in a single session. A trader who correctly guesses the direction can still lose money on a long straddle if the stock moves less than the crush costs.
Key Metrics to Check Before Placing an Earnings Trade
Four numbers decide whether a trade is worth placing at all: the expected move, IV Rank, single name VRP, and liquidity.
The expected move comes from the at-the-money straddle price divided by the stock price, giving you a working one standard deviation band for the move. If a $100 stock has a $6 ATM straddle, the market is pricing roughly a move in either direction approximately equal to the straddle price divided by the stock price.
IV Rank and IV Percentile tell you where current implied volatility sits against its own trailing history, not against some universal benchmark. A stock with IV Rank above 50 to 70 tends to favor premium sellers, since volatility is elevated relative to where it usually sits. IV Rank under 30 flips the logic toward buyers, assuming you also have a directional thesis.
Single-name VRP, expressed as a z-score, measures how rich the current implied move is compared to the stock's own realized post-earnings moves over recent quarters. A high positive z-score is the clearest signal that premium is overpriced.
- Bid-ask spreads wider than 5% to 10% of the option's mid-price signal poor execution conditions.
- Open interest under a few hundred contracts at your target strike usually means you will pay for liquidity you cannot see.
- Weekly expiries nearest the event concentrate the most event variance and the sharpest crush.
Matching Signals to Structures: The Strategy Playbook
Once you have the expected move, IV Rank, and VRP z-score in front of you, the decision becomes mechanical rather than emotional. High IV Rank plus a positive VRP z-score points toward selling; low IV Rank with a cheap expected move points toward buying. Everything else is execution detail.
- Iron condors and credit spreads for sellers. Set short strikes around 10 to 15 delta on each side, buy the wings to define risk, and size the trade so max loss stays inside your per-event budget. Never sell naked strangles into an earnings print. One surprise gap can erase months of collected premium, and most retail accounts don't have the margin cushion to survive it.
- Long straddles or strangles for buyers, but only when the expected move genuinely looks underpriced against the stock's realized post-earnings history. This is the harder trade to win. Long straddles into earnings post an average one-day return well into negative territory, with win rates near one-third, because IV crush eats into gains even on correct directional bets.
- Directional tilts when you have conviction plus a volatility edge. Put credit spreads suit a bullish lean while collecting rich premium; a collar protects existing stock positions heading into an uncertain print without giving up all the upside.
Pro Tip: Run the VRP z-score and IV Rank together, never alone. A stock can show a high IV Rank simply because its whole sector is jumpy, while its specific VRP is actually thin. The z-score catches that gap the rank alone misses.
Selling premium wins more often, but it wins small and loses big on the rare miss. Buying premium loses more often but occasionally pays for five losing trades in one move. Neither approach works without strict sizing.
Timing, Strikes, and Order Execution That Don't Wreck the Trade
Expiry choice depends on when the company reports. A before-open print means the nearest expiry still holds a full day of decay risk after the crush; an after-close print means that same expiry opens the next day already stripped of most of its event premium. Front-month or weekly expiries closest to the event concentrate the bulk of the variance you're trying to capture or avoid, which is exactly why they're also the most mispriced when a trader ignores the calendar.
- Short strikes for premium sellers: target 10 to 15 delta, adjusted for how much cushion the expected move gives you.
- Straddle strikes for buyers: stay at-the-money, since moving off-strike just adds directional risk you didn't intend to take.
- Cap position size at a fixed percent of account equity per event, decided before you look at the chart.
- Use limit orders on every leg. Market orders on wide, thin option chains are how you donate your edge to a market maker.
- If spreads are wide, stagger legs or work the order in pieces rather than crossing the whole spread at once.
Sizing Rules That Keep You in the Game Across Many Quarters
Defined-risk trades, iron condors and credit spreads, should stay around 1% to 2% of capital per event. That ceiling exists because selling premium has a higher base-rate win rate but real tail risk when a stock gaps well beyond its expected move.
Undefined-risk exposure, if you use it at all, belongs under 0.5% to 1% of capital and only alongside a hedge that caps the downside. Most retail traders should skip it entirely.
Take profits mechanically rather than emotionally. Many spread traders close at 50% to 75% of max profit once IV crush has done its job, instead of holding for every last dollar and exposing the position to a reversal. When a trade does blow up, and eventually one will, a pre-written recovery plan (reduce size for several cycles, spread exposure across uncorrelated names, revisit the sizing math) beats improvising after a loss. Diversifying across sectors and report dates keeps one bad print from becoming an account event.
Trading the Aftermath: PEAD and Gap Setups
The cleanest earnings trades sometimes happen after the crush is already over. Waiting for volume confirmation and follow-through on the first or second day after a print filters out the noise of the initial reaction and often produces a better risk-reward entry than guessing pre-print direction.

Post-earnings announcement drift, PEAD, describes the tendency of stocks to keep drifting in the direction of an earnings surprise for days or weeks afterward. Traders who wait for a confirmed gap with volume support, then enter on the first pullback, are trading that drift rather than the initial event.
Gap trading carries its own overnight risk. Size any post-earnings position for the possibility of a second gap the following session, since drift is a tendency, not a guarantee.
How Discipline AI Reads Earnings Volatility Signals
Combining expected move, IV Rank, and VRP into one composite score removes most of the guesswork that trips up discretionary earnings traders. Discipline AI's platform generates confidence scores and execution guidance built on exactly that kind of signal blending, then tracks the outcome through automated trade journaling. That closes the loop between the rules above and what actually happened in your account, turning each earnings cycle into a data point rather than a guess.
Risk Strategies Beyond Simple Position Sizing
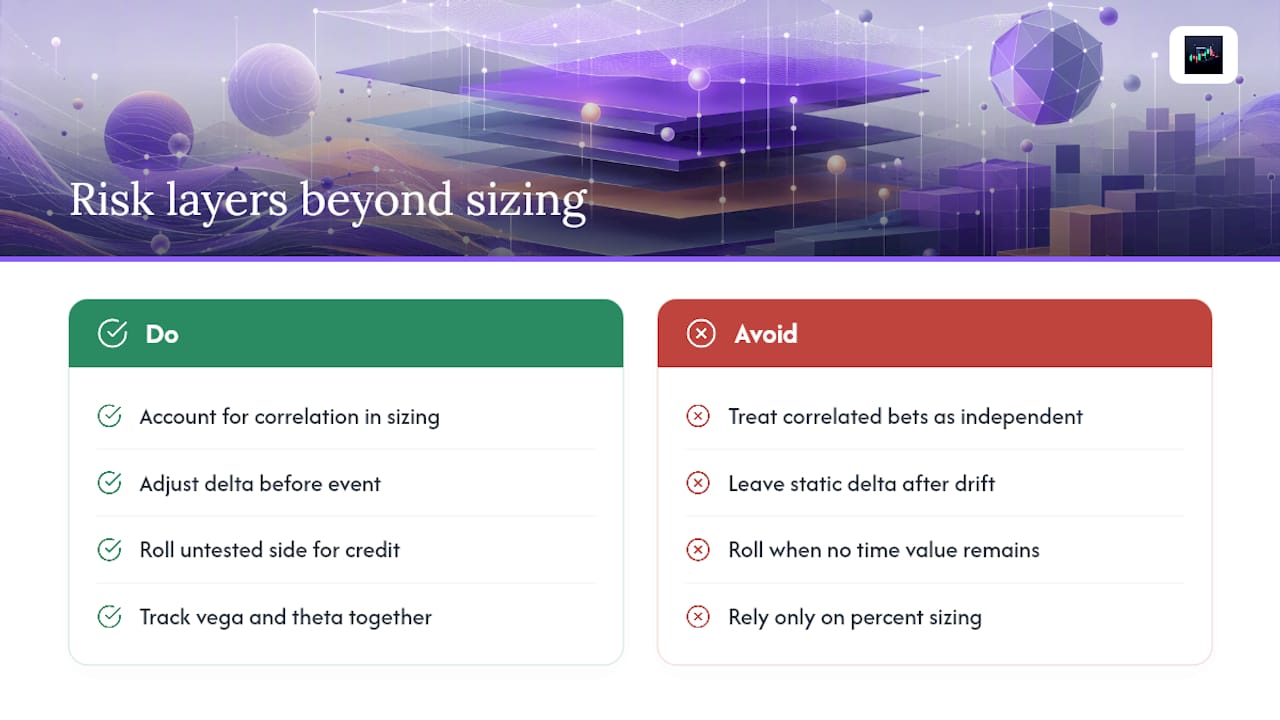
Position sizing sets your ceiling for loss, but it doesn't protect you from correlated blowups or from holding a trade past its usefulness. A few additional layers matter.
Correlation awareness. Trading five earnings events in the same week inside one sector, say four regional banks reporting alongside a rate decision, isn't five independent bets. A macro surprise can move all of them the same direction at once, so treat correlated names as a single larger position for sizing purposes.
Delta hedging mid-trade. If a stock drifts meaningfully before the actual print (on a leaked estimate, an analyst note, or sector news), a static straddle or condor stops being delta-neutral. Adjusting delta exposure a day or two before the event keeps the trade aligned with its original thesis instead of accidentally becoming a directional bet.
Rolling versus closing. When a short spread gets tested but hasn't breached max loss, rolling the untested side closer can collect additional credit and buy room. It only works when there's still time value left to harvest, which usually means before the crush has fully played out.
Vega and theta tracking together, not separately. A position can look fine on theta decay alone right up until a vega shock from a surprise guidance cut erases days of collected premium. Watching both Greeks side by side, rather than checking one and assuming the other behaves, catches that mismatch before it costs money.
None of this replaces sizing discipline. It sits on top of it, catching the risks that a flat percent-of-capital rule alone doesn't see coming.
Seasonal Patterns in Earnings Volatility Worth Tracking
Earnings volatility isn't evenly distributed across the calendar. The heaviest reporting weeks, mid-January, mid-April, mid-July, and late October, cluster hundreds of prints into a handful of trading days, which compresses liquidity across market maker books and can widen spreads on even normally liquid names.
Certain sectors show more consistent seasonal volatility than others. Retailers see their sharpest moves around holiday-quarter earnings in January and February, when comparable-sales numbers either confirm or blow up the holiday narrative analysts built all fall. Energy names swing harder during quarters that follow sharp commodity price moves, since earnings become a referendum on hedging decisions made months earlier.
A senior thesis on estimating earnings volatility found that modified option pricing models incorporating historical earnings-move data produced positive backtest results when combined with disciplined sizing, reinforcing that a stock's own multi-quarter pattern carries more predictive weight than treating every print as a fresh coin flip. A stock that has gapped more than its expected move in three of its last four reports is telling you something about its own volatility regime that a single quarter's IV Rank won't capture.
None of this is a guarantee. Academic research shows implied volatility can rise rather than fall after roughly a quarter of earnings reports, often tied to how a company's disclosure behavior shifts in response to prior market reactions. Seasonality and history set the odds. They don't remove the tail.
How Macro Conditions and Sector Trends Shift Earnings Volatility
Earnings volatility doesn't exist in a vacuum separate from the broader market. When the Federal Reserve is mid-cycle on rate decisions, or when a major inflation print lands the same week as a batch of earnings, baseline market volatility bleeds into single-name IV regardless of how clean the individual company's numbers are. Expected moves widen across the board in those weeks, not because any one company got riskier, but because the whole options market is pricing in more uncertainty.
Sector dynamics compound this. Semiconductor names have shown a pattern of correlated earnings reactions in recent cycles. When one major chipmaker reports and moves sharply on a guidance comment about demand, the whole sector's IV Rank can jump ahead of unrelated companies' own reports days later, inflating premium that has nothing to do with those individual businesses.
Regional banks show a similar clustering effect tied to interest rate sensitivity, and airline earnings tend to move together on fuel cost and travel demand commentary regardless of which specific carrier is reporting. Before trusting a single-name VRP z-score, check whether the sector as a whole is running hot. A stock showing rich premium purely because its peers are also reporting that week is a different trade than one showing rich premium on its own idiosyncratic uncertainty.
Currency-sensitive multinationals add another layer. A strong dollar quarter can turn an otherwise clean earnings beat into a miss on the headline revenue line, and options markets tend to price that translation risk into elevated IV for large exporters heading into a print.
Fitting Earnings Trades Into a Broader Portfolio
Earnings volatility trades work best as a satellite allocation, not the core of a portfolio. Treating each print as an isolated, small, defined-risk bet keeps any single stock's surprise from doing outsized damage to overall returns.
Diversifying across sectors and report dates reduces the chance that one bad macro week (a rate decision landing during peak earnings season, for example) hits every position at once. A portfolio holding earnings trades across retail, energy, and technology names reporting in different weeks spreads that correlation risk in a way a single-sector book cannot.
Collars deserve a second look here beyond their use as a standalone earnings hedge. An investor holding a long-term stock position through an uncertain quarter can use the collar structure to fund downside protection with upside premium, turning what would otherwise be a source of portfolio anxiety into a defined, budgeted risk. That's a fundamentally different use case from a pure earnings-volatility speculation trade, even though the options structure looks identical on paper.
Correlation between your earnings book and your core holdings matters too. A trader running mostly long equity exposure who also sells naked volatility into earnings on similar names is stacking, not diversifying, risk. Premium selling earns cleaner diversification value when it's placed on names uncorrelated with the rest of the book, or hedged directly against a related core position.
Reading Implied Skew and Term Structure Around Earnings
The at-the-money IV number gets most of the attention, but skew and term structure carry information the flat number misses. Skew, the difference in implied volatility between out-of-the-money puts and calls, tends to steepen into earnings for stocks where the market fears a larger downside surprise than upside one. A steep put skew ahead of a print is the options market quietly pricing asymmetric risk, even when the ATM straddle looks unremarkable.
Term structure, the relationship between near-term and longer-dated IV, is what actually isolates the earnings event from the market's general volatility level. A stock might show an elevated 30-day IV simply because the broader market is jumpy, but if you compare that to the IV of an expiry just past the earnings date, the term structure reveals how much of that elevation is genuinely tied to the event itself versus market-wide noise.
Calendar spreads exploit exactly this gap, selling the expensive near-term expiry that contains the event and buying a further-dated expiry at a relatively cheaper level. It's a more nuanced read than a single IV Rank number, and traders who only check the flat ATM figure miss both the skew warning and the term structure signal entirely.
Platforms and Tools for Tracking Earnings Volatility in Real Time
Running this playbook by hand, pulling option chains, calculating expected move, checking IV Rank across dozens of names, gets unmanageable fast during peak earnings weeks when hundreds of companies report in a five-day window.
Options analytics platforms built for this purpose calculate expected move, IV Rank, and volatility risk premium automatically, refreshing as new option prints hit the tape. ORATS and similar data providers built specifically around volatility analytics give traders the historical IV context needed to judge whether current pricing is actually rich or cheap, rather than guessing from memory. Broker platforms increasingly build simplified versions of these same IV Rank and percentile tools directly into their options chains, which is a reasonable starting point for traders not ready to pay for a dedicated data feed.
Real-time alerting matters as much as the underlying calculation. A VRP z-score that looked attractive at market open can shift meaningfully by the time you actually place the trade if the stock moves or broader IV compresses. Tools that push liquidity and volatility alerts as conditions change, rather than requiring a manual refresh, close that gap between signal and execution. Discipline AI's platform tracks liquidity and volatility events across multiple assets and timeframes for exactly this reason, surfacing changes as they develop instead of after the trade window has closed.
What Most Traders Get Wrong About Earnings Trades
The biggest mistake isn't a bad structure choice. It's sizing a trade based on conviction rather than on the actual VRP and IV Rank numbers in front of you. Revenge trading after an IV crush loss, doubling the next position to "make it back," is how one bad quarter turns into a bad year.
Before any earnings trade, check three things: the expected move from the ATM straddle, the IV Rank and VRP z-score together, and whether the option chain has enough liquidity to get out cleanly if the thesis breaks.
— Tony
How Discipline AI Helps You Run This Playbook
Reading expected move, IV Rank, and VRP correctly for one stock is manageable. Doing it across a watchlist during a busy earnings week, while also tracking liquidity and sizing discipline, is where most traders fall behind.

Discipline AI's platform builds the expected-move calculation, IV Rank tracking, and liquidity alerts described throughout this playbook directly into its signal engine, then attaches a confidence score to each setup so you're not eyeballing whether premium looks rich or cheap. Behavioral coaching and automated trade journaling flag the sizing mistakes and revenge-trade patterns that quietly erode an account over a full earnings season. None of this guarantees a winning trade. It's a tool for operationalizing the rules, not a replacement for your own risk decisions. If you want to see how the composite signals map onto a live watchlist, start with Discipline AI and check how a current earnings setup scores before your next position.
Sources
- Volatility around earnings - ORATS University
- Complete Guide to Trading Earnings Volatility: IV Crush, VRP & Expected Move | FlashAlpha
- Using implied volatility percentiles - Schwab Learn