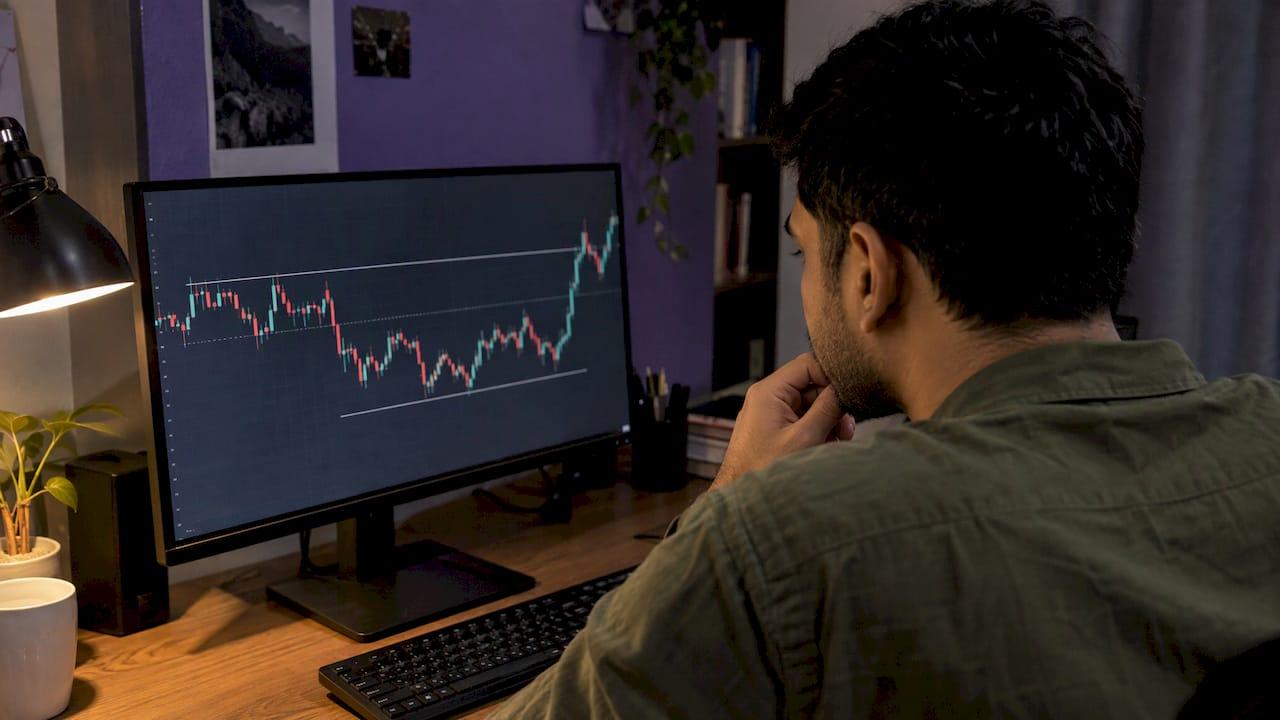
Asian session bias is your working read on which way price is leaning, up, down or sideways, during the Asian trading hours, and how that lean sets up the London and New York sessions that follow. You build it from where price sits against the session open, the prior day's levels and the Asian range. You treat it as a hypothesis to test, not a forecast. Below: the hours in US time, a three-step method for calling the bias, the strategies traders pair with it, and the risk rules that keep a wrong call small.
TL;DR
- Asian session bias is a bullish, bearish or neutral label for the Asian hours, built from price versus the session open, prior-day levels and the overnight range.
- Using Investopedia's UTC window, the session runs roughly 6 p.m. to 4 a.m. Eastern in winter and 7 p.m. to 5 a.m. Eastern in summer.
- Asian hours are usually quieter, so "neutral" or "stand aside" is a legitimate bias, and range edges matter more than trend.
- Define the invalidation level before entry, size from that distance, and log every call so you can measure whether your bias has an edge.
Table of Contents
- What Asian session bias actually means
- Asian session hours in US time
- What the Asian session is like: volume, volatility, liquidity
- Which markets are active in Asia
- How to call the bias: bullish, bearish or neutral
- Asian session strategies that use the bias
- Managing risk in a quiet session
- Test your bias instead of trusting it
- Our perspective
- Put your Asian session routine on rails
- FAQ
- Sources
What Asian session bias actually means
A session bias is a short statement you can write down before the session gets going: "Asia is leaning bullish while price holds above the open and yesterday's low," or "Asia is neutral, inside a tight range." It has three possible values: bullish, bearish or neutral.
Two things make it useful rather than decorative:
- It is conditional. A good bias comes with the level that proves it wrong. If price closes back through that level, the bias is gone.
- It is about context, not entries. The bias tells you which setups to look for and which to skip. It does not tell you to buy or sell at a given moment.
Traders often treat the Asian range as the setup for what follows. The idea is that the overnight high and low become reference points that later sessions react to. That is a widely taught pattern, not a law of markets, so test it on your own instruments before you rely on it.
Asian session hours in US time
There is no official clock for the forex session. Investopedia describes Asian activity as unofficially represented by Tokyo capital markets, spanning 11 p.m. to 9 a.m. UTC. CME Group uses 00:00 to 09:00 GMT for the Asian hours in its own reporting.
Converting Investopedia's window to US Eastern time (our arithmetic, since the US shifts clocks and UTC does not):
| Season | Asian session in UTC | Eastern time | Pacific time |
|---|---|---|---|
| Standard time (early November to mid-March) | 11 p.m. to 9 a.m. | 6 p.m. to 4 a.m. | 3 p.m. to 1 a.m. |
| Daylight time (mid-March to early November) | 11 p.m. to 9 a.m. | 7 p.m. to 5 a.m. | 4 p.m. to 2 a.m. |
Many US traders simplify this to "evening to the early morning hours" and mark their own chart session from about 7 p.m. to 4 a.m. Eastern. Whatever window you choose, keep it fixed so your ranges are comparable day to day.
The week begins here too. Investopedia notes that Asian markets are the first to see action when FX liquidity returns at the start of the week, so Sunday evening in the US is the first read of the week's tone.
What the Asian session is like: volume, volatility, liquidity
The data points in one direction: quieter, but not dead.
- In E-mini S&P 500 futures, academic research found volatility during the Asian session is 30% lower than during the European segment, which is itself 50% lower than during the U.S. session. Asia contributes 12% of total daily returns variance, and per-minute volume is 5.5 times lower than in Europe. Average E-mini trade size is lowest in Asian hours, at 3.5 contracts.
- In currencies, CME Group reported that as of July 3, 2023, an average of over 180,000 G7 futures contracts traded daily during Asian hours, more than 20% of global G7 futures volume, with over 47,000 unique users. The same article says USD/JPY spreads are lowest in those hours, between 1.03 and 1.15 pips.
- Investopedia says the session often has lower volatility than others, with more reserved, technical trading and smaller price movements.
Translate that into practice. Smaller average moves mean tighter ranges, and tight ranges mean the range edges are where the information is. They also mean a breakout needs more scrutiny than it would at the New York open. Spreads on yen pairs can be tight, which helps small stops, but thin liquidity can still produce sudden spikes around data releases.
Which markets are active in Asia
Forex. Pairs tied to the region's currencies see the most natural flow: USD/JPY, AUD/USD, NZD/USD, AUD/JPY and the other yen crosses. CME's data shows USD/JPY is a standout for tight spreads in these hours. Pairs with no Asia-Pacific link, such as EUR/GBP, tend to drift until Europe arrives.
Stocks and indices. Equity trading is limited by regional exchange hours, including Tokyo's lunch break. A broker's market-hours guide notes that indices like the Nikkei 225 often react to overnight moves in U.S. technology stocks. For US-based stock traders, that means the Asian session can be a read on how your own market's close is being digested overseas.
Crypto. Bitcoin and other majors trade around the clock, with no opening bell. The same guide notes that crypto volume tends to follow when Asian traders are awake, and that it can move on regional flow, news from Asian exchanges and stablecoin activity. Because there is no official session open, crypto traders usually pick a reference time, often the 8 p.m. Eastern hour or midnight UTC, and measure bias from that price.

How to call the bias: bullish, bearish or neutral
Here is a repeatable three-step routine. Do it before the session starts, then update at fixed checkpoints rather than every candle.
Step 1: Mark the reference levels
Write down four numbers on your chart:
- The previous day's high and low
- The previous New York close
- The Asian session open (your fixed reference time)
- The running Asian high and low
Step 2: Compare price with the open and the prior levels
A simple rule set many traders use:
- Bullish lean: price holds above the session open and above the prior day's low, with higher lows forming inside the session.
- Bearish lean: price holds below the session open and below the prior day's high, with lower highs forming.
- Neutral: price keeps crossing the open, or the range is narrow compared with recent sessions. This is the most common state in quiet hours.
The label can also be reduced to one question: is price accepted above or below the open, or is it rotating around it?
Step 3: Add the higher-timeframe and event context
A bullish Asia lean inside a daily downtrend is a weaker claim than one with the daily trend behind it. Check the 4-hour and daily direction. Then check the calendar: Japanese, Australian and Chinese data, central bank meetings and any US news that landed late in the previous New York session can all override a technical lean.
| Condition | Bias | What it suggests |
|---|---|---|
| Above open, higher lows, daily trend up | Bullish | Look for pullbacks toward the open or range low |
| Below open, lower highs, daily trend down | Bearish | Look for rallies toward the open or range high |
| Crossing the open, narrow range | Neutral | Fade the edges with small size, or stand aside |
| Big data release due, mixed signals | Unclear | Wait until after the release |
Asian session strategies that use the bias
Traders usually work with one of three approaches. None is guaranteed, and each should be tested before it gets real money.
1. Range trading. When the bias is neutral, price often rotates between the session high and low. You look for rejections at the edges, place the stop just beyond the range, and aim for the middle or the opposite edge. The risk is a breakout that turns a range trade into a loss, so the stop is non-negotiable.
2. Trend continuation. When the bias is directional and price is accepted above or below the open, you wait for a shallow pullback and enter in the direction of the lean, with the stop beyond the pullback low or high. Quiet markets can make these moves slow, so patience matters more than speed.
3. Using the Asian range as a map for later sessions. Many traders do not trade Asia at all. They record its high and low and watch how price behaves when London or New York reaches those levels, for example a sweep of the high that quickly fails. This is the "liquidity sweep" idea popular in online communities. It is a pattern you can measure rather than assume: count how often it happens on your pair, and what happens next.
If your schedule only allows evening trading, the Asia session can still suit you. Keep to a small number of instruments, such as yen or Australian dollar pairs, and avoid pairs with no regional driver.

Managing risk in a quiet session
Low volatility does not mean low risk. It can mean thin books, wider reaction to surprises and a false sense of safety that leads to oversized positions.
- Set the invalidation first. The bias is wrong if price closes beyond a specific level. That level is your stop reference.
- Size from the stop, not the other way around. Decide the dollar amount you accept losing, divide by the stop distance, and that is your position size. Tight Asian ranges tempt people to add leverage. Resist it.
- Respect scheduled events. Flatten or reduce before major releases and central bank decisions.
- Allow "no trade" as an outcome. If the range is tiny and the signals conflict, standing aside is a decision, and often the best one.
- Keep a daily loss limit. A few quiet-session losses in a row usually mean the market is not giving you the pattern you expected.
Leveraged products such as forex and crypto derivatives can lose money quickly. Position size and leverage should match your own account and risk tolerance, and if you are unsure, a licensed financial professional can help you set limits.
Test your bias instead of trusting it
A bias is only valuable if it beats a coin flip after costs. The way to find out is to record every call.
For each session, log the instrument, your bias label, the reference levels, what you did, and the result. After 50 to 100 sessions you can sort by label and see whether bullish calls, bearish calls or neutral calls carry any edge, and whether certain pairs or days work better. Sample size matters: ten sessions prove very little.
Our guides on trading journal fields that reveal your edge and fixing outcome tracking in under 60 seconds show what to capture so the review is quick enough that you actually do it. If you tend to break your own rules late at night, the trader behavior tracking guide covers how to spot those patterns.
Our perspective
Most session-bias content stops at a label. We think the label is the easy part. The hard part is knowing whether conditions deserve a trade at all, and whether your own history supports the call you just made.
That is how we built Discipline AI. Our Sentinel research system looks at market structure, liquidity events, trend direction, volatility and market regimes across multiple cryptocurrencies and timeframes, and studies how strategies have performed in favorable and unfavorable environments. Part of its job is to help traders see when conditions call for caution or standing aside, which is exactly what a neutral Asian session is asking for.
We put evidence ahead of prediction: win rate, risk-adjusted expectancy, reward-to-risk, market compatibility and sample size. We do not guarantee profitable trades, and no bias label can. What we can do is give you paper trading to practice a bias routine, risk planning with position sizing, and journaling and AI Trade Autopsies to learn from the outcomes.
Discipline is repeating a process you have measured. That is the point of everything we build.
Tony
Put your Asian session routine on rails
If you want the routine above to run inside one app, Discipline AI brings market-condition analysis, AI-generated trade setups with confidence and quality assessments, position sizing and leverage tools, paper trading, automated journaling and performance analytics to iOS and Android. The Pro plan is $8.99 per month, $79.99 per year or $199.99 one-off. See the details on the Discipline AI pricing page.
If you want to practice first, paper trading lets you run your Asian bias calls without risking capital, and the journal records the outcomes for review. For a deeper look at how the research layer works, visit Sentinel Cloud.
FAQ
What are the Asian session hours in US time?
Using a window of 11 p.m. to 9 a.m. UTC, the session runs about 6 p.m. to 4 a.m. Eastern during standard time and 7 p.m. to 5 a.m. Eastern during daylight time. Forex has no official clock, so pick one window and keep it consistent. Crypto has no session open, so choose a reference time.
Is the Asian session good for trading?
It can suit traders who prefer quieter, range-based conditions, especially in yen and Australian dollar pairs. Volatility and volume are lower than in the European and US sessions, so moves are smaller and breakouts need more confirmation. Whether it suits you depends on your results, which a trade journal will show over a meaningful sample.
What does a neutral Asian session bias mean?
It means price is rotating around the session open without acceptance on either side, or the range is too narrow to favor a direction. Traders either fade the range edges with small size or wait. Neutral is a valid call, and often the most common one in quiet hours.
Which pairs are best to watch during the Asian session?
Pairs with a regional driver are the usual focus: USD/JPY, AUD/USD, NZD/USD and the yen crosses. CME Group reports that USD/JPY spreads are at their lowest in Asian hours. Pairs without an Asia-Pacific link tend to be slower until Europe opens.
Can I use the Asian range for trades in other sessions?
Yes, many traders mark the Asian high and low and watch how price reacts when London or New York trades through them. Treat it as a pattern to measure, not a rule. Count how often it works on your instrument before sizing up.
Sources
- Investopedia: The Forex 3-Session Trading System
- CME Group: Unique Liquidity, Clear Benefits: Unlocking Asian Hour Potential with CME FX Futures
- Northern Finance Association: Market Return Around the Clock: A Puzzle
- Forex and Gold Market Hours: When Markets Open and Close